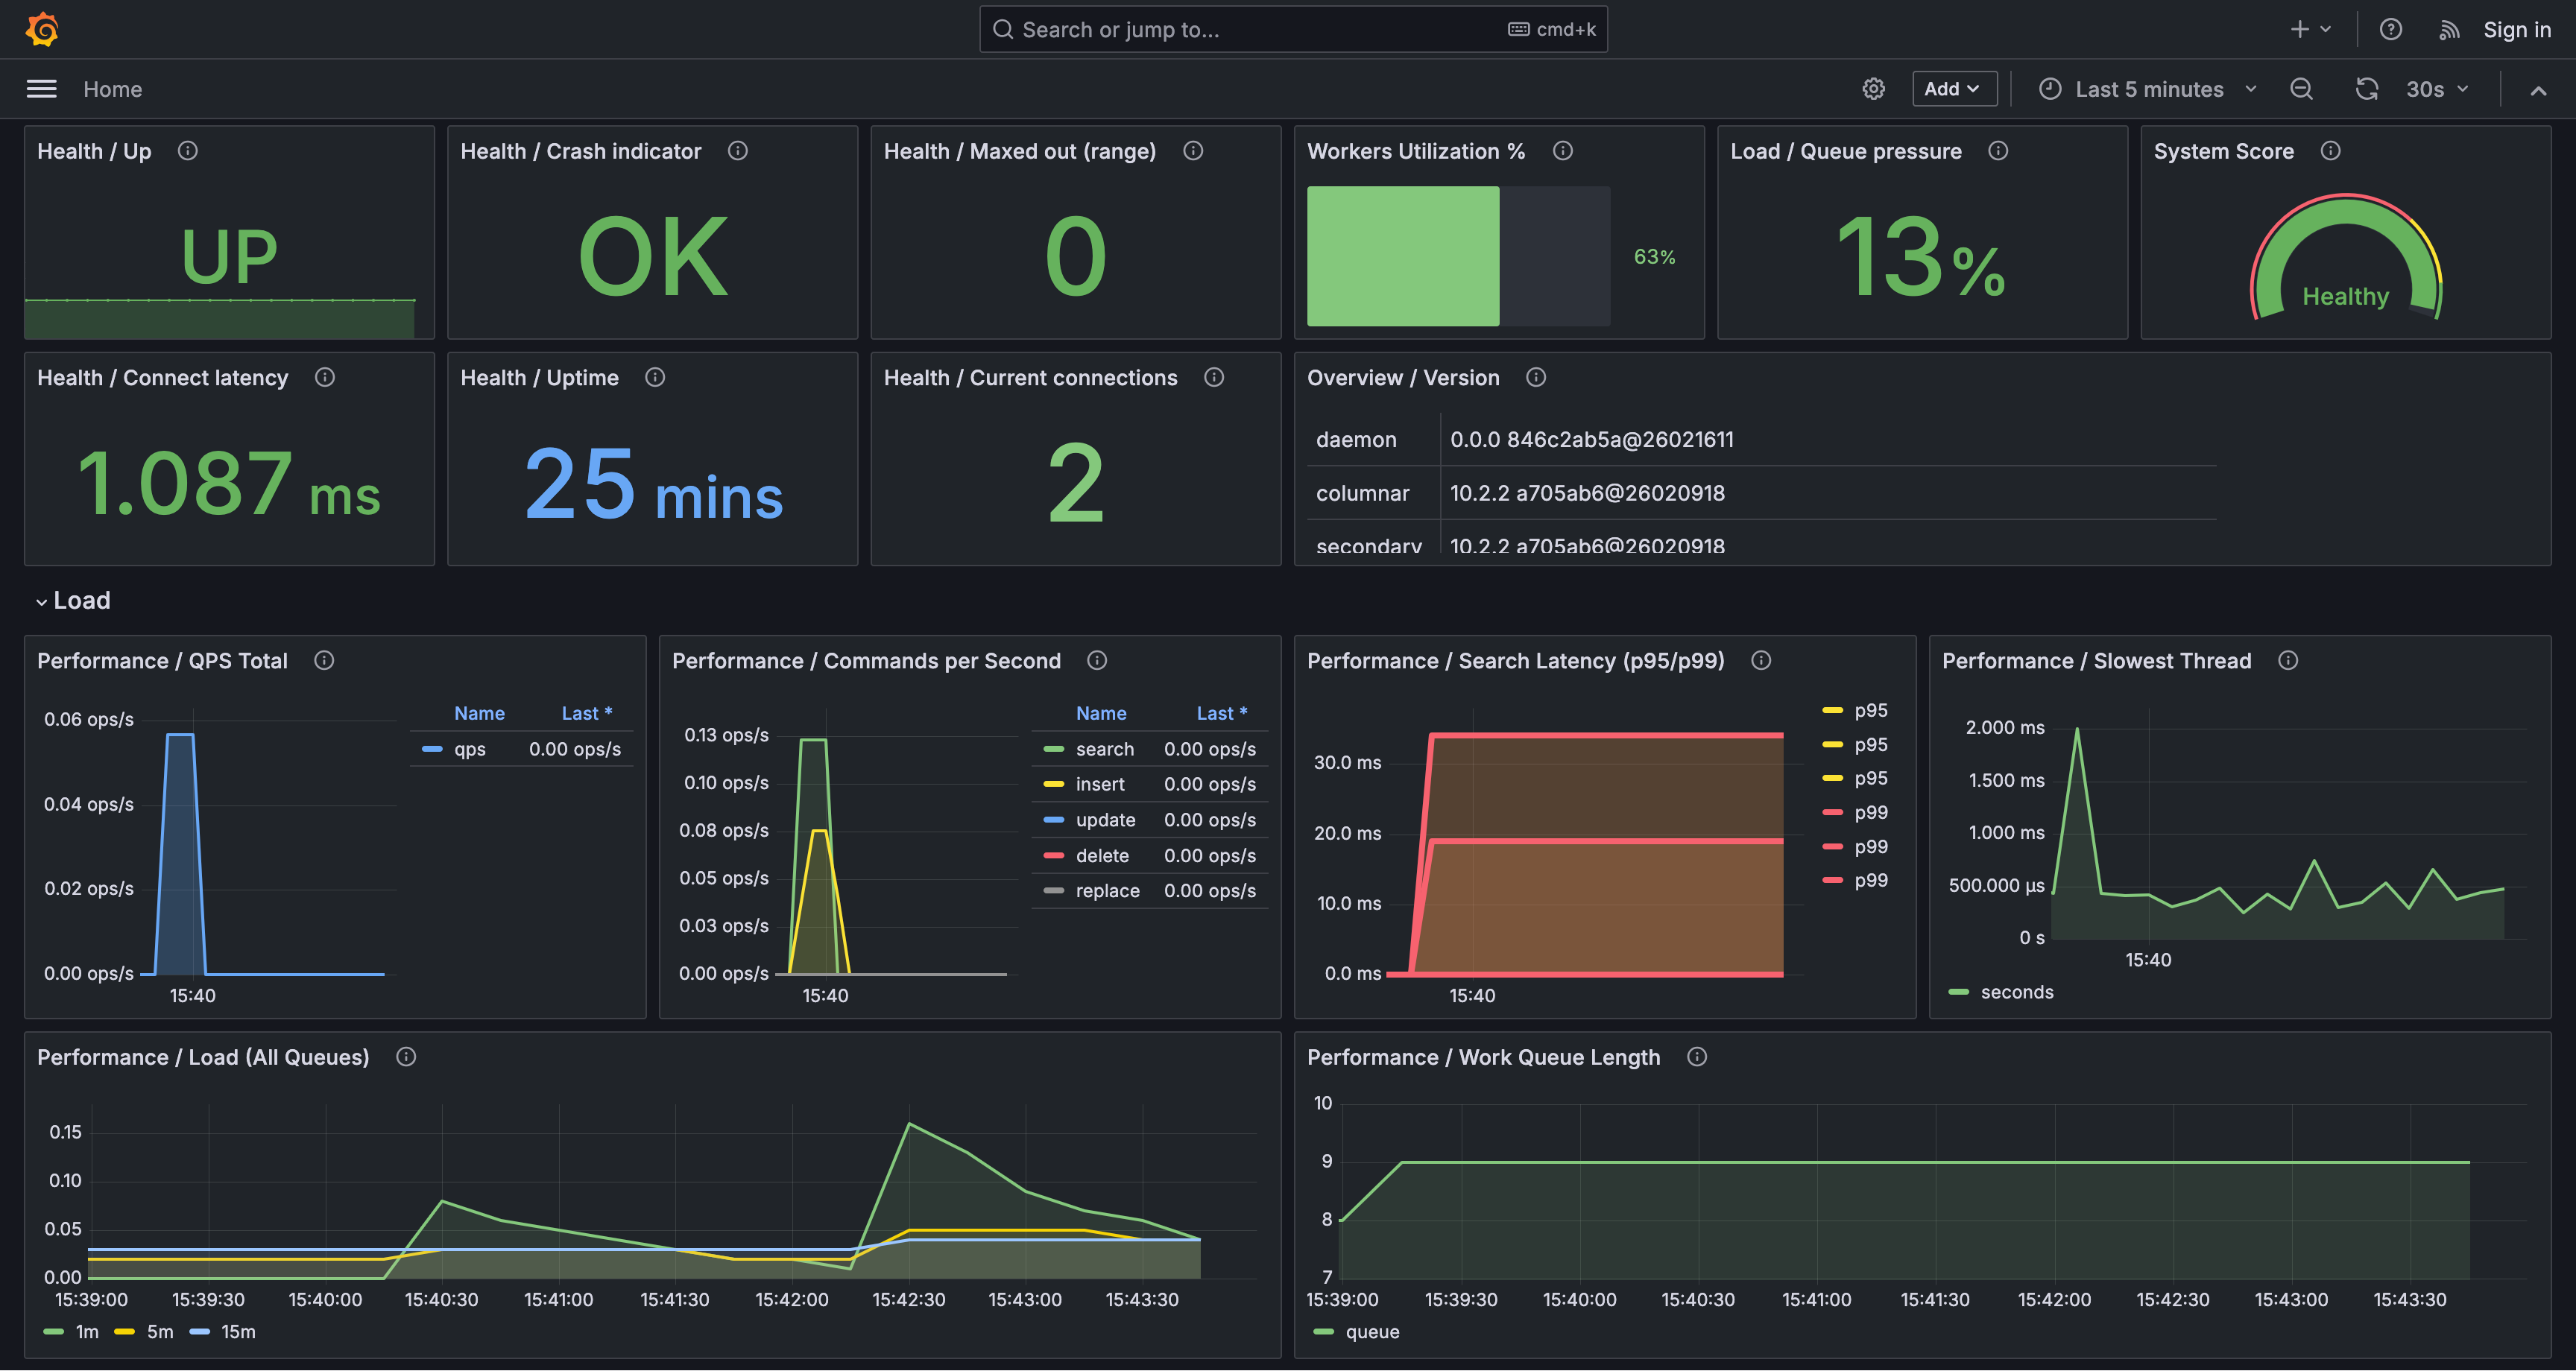
Kibana is a visual interface that allows you to explore, visualize, and create dashboards for your log data. Integrating Kibana with Manticore Search can speed up the loading of Kibana visualizations by up to 3 times compared to Elasticsearch, as demonstrated in this demo. This integration enables users to seamlessly analyze their data using interactive dashboards, custom visualizations, and real-time search capabilities. It also simplifies handling diverse data sources by supporting tools like Logstash and Filebeat for streamlined data ingestion, making it a great choice for log analysis workflows.
- Download Kibana: Ensure you download a Kibana version compatible with Manticore. Currently, version 7.6.0 is tested and recommended. Other 7.x versions may work but could introduce issues. Version 8.x is not supported.
- Verify Manticore: Ensure your Manticore instance is running and its HTTP API is reachable (default:
http://localhost:9308).
- Open the Kibana configuration file (
kibana.yml). - Set the URL of your Manticore instance:
elasticsearch.hosts: ["http://localhost:9308"] - Start Kibana and open it in your browser at
http://localhost:5601. Replacelocalhostwith your server's IP or hostname if necessary.
Note: Manticore does not require authentication setup when working with Kibana. Also note that Manticore must work in real-time mode to be integrated with Kibana.
    listen = 127.0.0.1:9308:http
    pid_file = /var/run/manticore/searchd.pid
    data_dir = /var/lib/manticore
 }

## Supported Features
### Discover
- Use the **Discover** tab in Kibana to search and filter your data interactively.
- Refine your searches using the query bar with simple queries in the %Kibana query language [https://www.elastic.co/guide/en/kibana/current/kuery-query.html] %.

### Visualizations
- Navigate to **Visualizations** to create custom visualizations:
  - Create a table pattern (it’s called an 'index pattern' in Kibana) if one doesn’t already exist to define your data source.
  - Choose a visualization type (e.g., bar chart, line chart, or pie chart).
  - Configure your visualization, execute it, and explore your data.
  - Save your visualizations for future use.

### Dashboards
- Access **Dashboards** to create or view interactive dashboards:
  - Add visualizations, filters, or controls for a personalized experience.
  - Interact with your data directly from the dashboard.
  - Save dashboards for future use.

### Management
- Go to **Management > Kibana** to customize settings like default time zones and visualization preferences.

## Limitations
- Currently, Kibana version 7.6.0 is tested and recommended. Other 7.x versions may work but could cause issues. Versions 8.x are not supported.
- The following Elasticsearch-specific field types are not supported:
  - %Spatial data types [https://www.elastic.co/guide/en/elasticsearch/reference/current/mapping-types.html#spatial_datatypes] %
  - %Structured data types [https://www.elastic.co/guide/en/elasticsearch/reference/current/mapping-types.html#structured-data-types] %
  - %Document ranking types [https://www.elastic.co/guide/en/elasticsearch/reference/current/mapping-types.html#document-ranking-types] %
  - %Text search types [https://www.elastic.co/guide/en/elasticsearch/reference/current/mapping-types.html#text-search-types] % (except for plain 'text')
  - %Relational data types [https://www.elastic.co/guide/en/elasticsearch/reference/current/mapping-types.html#object-types] %
- Metric aggregation functions are limited to %those supported by Manticore [../Searching/Grouping.md#Aggregation-functions] %.
- The following Kibana tools are not supported:
  - %Canvas [https://www.elastic.co/guide/en/kibana/7.6/canvas.html] % – A visualization and presentation tool for combining data with colors and images.
  - %Elastic Maps [https://www.elastic.co/guide/en/kibana/7.6/maps.html] % – A tool for analyzing geographical data.
  - %Metrics [https://www.elastic.co/guide/en/kibana/7.6/xpack-infra.html] % – An app for monitoring infrastructure metrics.
  - %Logs [https://www.elastic.co/guide/en/kibana/7.6/xpack-logs.html] % – A console-like display for exploring logs from common services.
  - Monitoring:
    - %Uptime [https://www.elastic.co/guide/en/kibana/7.6/xpack-uptime.html] % – Monitors the status of network endpoints via HTTP/S, TCP, and ICMP.
    - %APM (Application Performance Monitoring) [https://www.elastic.co/guide/en/kibana/7.6/xpack-apm.html] % – Collects in-depth performance metrics from applications.
    - %SIEM (Security Information and Event Management) [https://www.elastic.co/guide/en/kibana/7.6/xpack-siem.html] % – An interactive workspace for security teams to triage events and conduct initial investigations.
    - %ILM (Index lifecycle management) [https://www.elastic.co/guide/en/elasticsearch/reference/7.6/index-lifecycle-management.html] % - Automatically manage indices according to performance, resiliency, and retention requirements.
    - %Stack Monitoring [https://www.elastic.co/guide/en/kibana/7.6/xpack-monitoring.html] % – Provides visualizations of monitoring data across the Elastic Stack.
  - %Elasticsearch Management [https://www.elastic.co/guide/en/kibana/7.6/management.html] % – A UI for managing Elastic Stack objects, including ILM (Index Lifecycle Management), etc.

## Data Ingestion and Exploration
Integrate Manticore with tools like %Logstash [../Integration/Logstash.md] %, %Filebeat [../Integration/Filebeat.md] %, %Fluentbit [https://manticoresearch.com/blog/integration-of-manticore-with-fluentbit/] %, or %Vector.dev [https://manticoresearch.com/blog/integration-of-manticore-with-vectordev/] % to ingest data from sources like web logs. Once the data is loaded into Manticore, you can explore and visualize it in Kibana.