注意:某些仪表板面板和指标需要 Manticore Buddy。如果某些面板显示为空,请确保已安装Buddy。
Grafana 是一个用于数据可视化和监控的开源平台,它支持创建交互式仪表板和图表。Manticore Search 可以通过两种主要方式与Grafana集成:
- 监控Manticore性能:使用Prometheus从Manticore收集指标并在Grafana仪表板中进行可视化。这种方法专注于搜索引擎本身的系统健康状况、性能监控和告警。
- 可视化搜索数据:通过MySQL连接器查询并显示存储在Manticore表中的数据,类似于Kibana用于Elasticsearch数据可视化的方式。这对于分析趋势、聚合和基于索引数据的自定义可视化非常理想。
目前已测试并支持 Grafana 10.0-13.1 版本。
Manticore在专用仓库 manticoresoftware/grafana-dashboard 中提供了预构建的Grafana仪表板和Prometheus告警规则。该仓库还包含一个集成Grafana和Prometheus的一体化Docker镜像,用于快速启动。这些资源可以独立于您现有的Grafana和Prometheus设置使用,使您能够监控Manticore的操作指标(如延迟、资源使用情况和错误),而无需运行单独的实例。
对于完全预配置的设置,请运行专为Manticore监控定制的包含Grafana和Prometheus的一体化Docker镜像。如果您没有现有设置或想要一个快速测试环境,这非常理想:
docker run -e MANTICORE_TARGETS=localhost:9308 -p 127.0.0.1:3000:3000 manticoresearch/dashboard:latest
MANTICORE_TARGETS 是以 host:port 格式表示的Manticore HTTP端点的逗号分隔列表(例如:localhost:9308,10.0.0.5:9308)。
如果您已经有运行中的Grafana和Prometheus,可以跳过Docker镜像,直接导入仪表板和告警规则,如下面所述。
将Manticore仪表板添加到现有的Grafana实例中:
- 在Grafana中,导航到 Dashboards → New → Import。
- 上传 manticore-dashboard.json 文件(或粘贴其JSON内容)。
- 在提示时选择您的Prometheus数据源。
- 如有必要,验证并调整
job 仪表板变量(默认预期标签值为 manticoresearch)。
将Manticore告警规则集成到现有的Prometheus设置中:
- 下载 manticore-alerts.yml 并将其添加到您的Prometheus
rule_files 配置中。
- 如果您的抓取作业名称与
manticoresearch 不同,请相应地更新规则中的 {job="manticoresearch"} 匹配器。
- 重新加载或重启Prometheus以应用更改。
manticore-alerts.yml 文件旨在关注与可用性、过载和资源耗尽相关的关键信号——这些问题通常直接影响用户。阈值设置为安全默认值;根据您的具体工作负载进行调整。
- Manticore目标不可达 (
严重): Prometheus 无法抓取 Manticore (up == 0 持续 2 分钟)。这通常表示指标端点已关闭、无法访问或抓取配置不正确。
- Manticore最近重启 (
警告): 运行时间在 5 分钟内持续低于 5 分钟。这通常表明不稳定,例如崩溃循环、内存不足终止或编排器重启。
- Manticore达到错误上限 (
警告): manticore_maxed_out_error_count 在过去 5 分钟内增加。Manticore 因达到容量、并发性或资源限制而拒绝请求。
- Manticore搜索延迟P95过高 (
警告): P95 搜索延迟超过 500 毫秒持续 10 分钟。许多用户可能会觉得搜索速度变慢。
- Manticore搜索延迟P99过高 (
严重): P99 搜索延迟超过 1,000 毫秒持续 10 分钟。尾部延迟严重升高,表明最坏情况下的请求非常缓慢。
- Manticore工作队列积压 (
警告): 工作队列长度超过 100 持续 5 分钟。请求正在累积,通常会导致延迟增加。
- Manticore工作线程饱和 (
警告): 超过 90% 的工作线程处于活动状态持续 10 分钟。工作线程接近满负荷,可能会导致更高的延迟和排队。
- Manticore查询缓存接近限制 (
警告): 查询缓存使用率超过其配置最大值的 90% 持续 10 分钟。这会增加缓存抖动和驱逐的风险,可能减慢查询;考虑扩展缓存或优化查询模式。
- Manticore代理重试次数高 (
警告): manticore_agent_retry_count 在 5 分钟内增加超过 10 次。这通常指向远程代理的连接问题(例如网络问题、超时或分布式查询失败)。
- Manticore当前连接数高 (
警告): 当前连接数超过 500 持续 10 分钟。这可能表明流量激增、连接泄漏或慢客户端。
- Manticore最慢线程时间高 (
警告): manticore_slowest_thread_seconds 超过 30 秒持续 10 分钟。存在长时间运行或卡住的查询;调查慢查询和资源竞争。
- Manticore连接时间高 (
警告): manticore_connect_time_seconds 超过 0.2 秒持续 5 分钟。连接建立延迟(例如由于网络问题、TLS 开销或服务器过载)。
- Manticore搜索d最近崩溃 (
严重): manticore_searchd_crashes_total 在过去 10 分钟内增加。已发生崩溃;检查日志、核心转储和内存不足事件。
- Manticore二进制日志文件数高 (
警告): 二进制日志文件数超过 1,000 持续 10 分钟。这表明二进制日志未正确轮换或清理;检查二进制日志设置和磁盘使用情况。
- Manticore搜索d文件描述符数高 (
警告): searchd 文件描述符数超过 4,096 持续 10 分钟。这可能会达到操作系统限制;验证 ulimit -n、连接、打开文件和潜在泄漏。
- Manticore伙伴文件描述符数高 (
警告): 伙伴文件描述符数超过 4,096 持续 10 分钟。与上述类似,但针对伙伴进程。
- Manticore搜索d匿名RSS高 (
警告): searchd 匿名 RSS 超过 8 GiB 持续 10 分钟。高非文件后备内存使用;检查内存增长、查询/索引模式和容器限制。
- Manticore伙伴匿名RSS高 (
警告): 伙伴匿名 RSS 超过 8 GiB 持续 10 分钟。伙伴内存使用量升高;检查伙伴日志和工作负载。
- Manticore未服务的表 (
警告): manticore.json 中列出的一个或多个表在 SHOW TABLES 中缺失持续 10 分钟。这通常意味着表加载失败或被删除/移动;检查启动日志和表路径。
- Manticore磁盘映射缓存低 (
警告): 磁盘映射缓存比率低于 50% 持续 15 分钟。可能增加磁盘 I/O,如果工作集超过 RAM,可能会减慢搜索。
- Manticore磁盘映射缓存非常低 (
严重): 磁盘映射缓存比率低于 20% 持续 15 分钟。严重的缓存未命中;预计磁盘 I/O 重和高延迟。
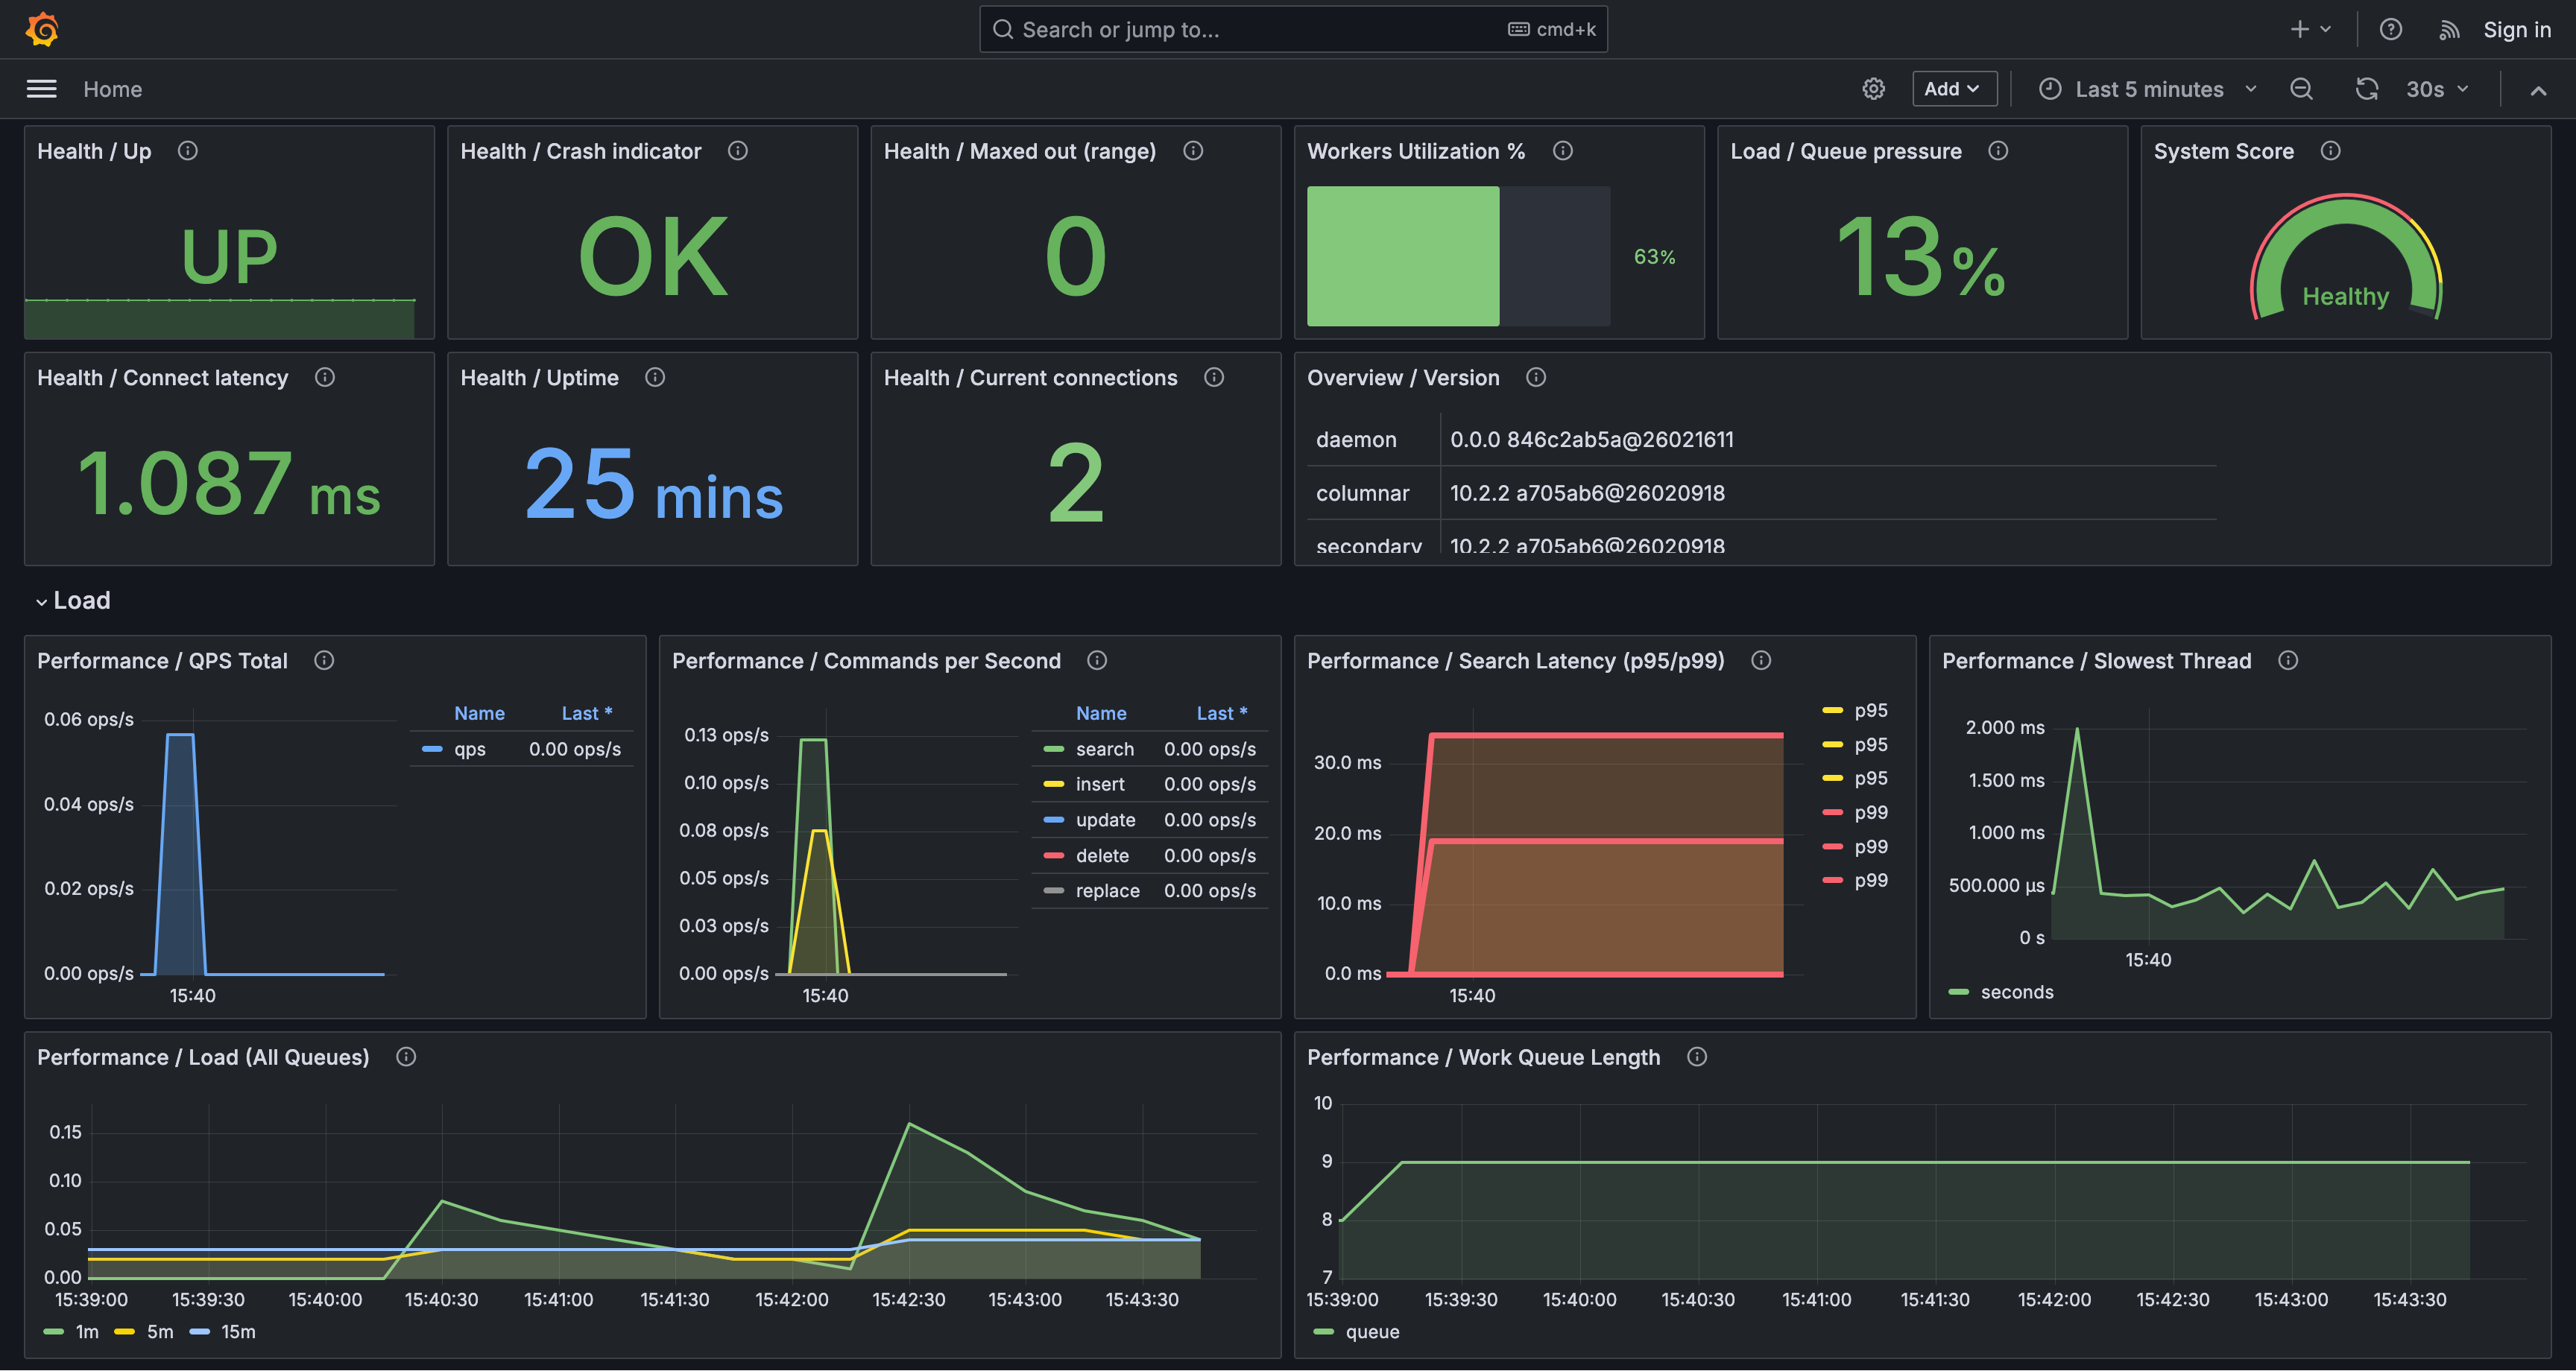
仪表板按主题组织面板。关键亮点包括:
- 健康 / 运行时间:自上次重启以来的时间;频繁下降表明重启或崩溃。
- 性能 / 搜索延迟(P95/P99):尾部延迟指标;持续增加通常表明过载或慢查询。
- 性能 / 工作队列长度 和 负载 / 队列压力:积压和排队指标;增长的队列表明系统滞后。
- 工作线程利用率 % 和 负载 / 活动/总工作线程:工作线程饱和度;值接近 100% 通常与更高延迟相关。
- 性能 / 查询缓存使用率 和 性能 / 查询缓存命中率:缓存压力和效果;高使用率与低命中率可能表明效率低下。
- 表 / 磁盘映射缓存比率(最差 10 个):低比率意味着更多磁盘读取和潜在的较慢查询。
此方法使用 Grafana 的 MySQL 连接器直接查询 Manticore 表,从而可视化您的搜索数据,例如时间序列趋势或聚合。
在设置数据可视化之前:
- 确保已安装并配置 Manticore Search(版本 6.2.0 或更高版本)。有关详细信息,请参阅 官方 Manticore Search 安装指南。
- 在您的系统上安装 Grafana。有关说明,请参阅 官方 Grafana 安装指南。
连接 Manticore Search 到 Grafana 的步骤:
- 登录 Grafana 仪表盘,在左侧边栏点击“配置”(齿轮图标)。
- 选择“数据源”,然后点击“添加数据源”。
- 从可用数据源列表中选择“MySQL”。
- 在设置页面填写以下信息:
- 名称:数据源名称(例如,“Manticore Search”)
- 主机:Manticore Search 服务器的主机名或 IP 地址(及 MySQL 端口,默认:
localhost:9306)
- 数据库:留空或指定数据库名
- 用户:有权限访问 Manticore Search 的用户名(默认:
root)
- 密码:指定用户的密码(默认为空)
- 点击“保存并测试”以验证连接。
连接 Manticore Search 到 Grafana 后,您可以创建仪表盘和可视化:
- 在 Grafana 仪表盘左侧边栏点击“+”图标,选择“新建仪表盘”。
- 点击“添加可视化”按钮,开始配置您的图表。
- 选择通过 MySQL 连接器连接的 Manticore Search 数据源。
- 选择您要创建的图表类型(例如,时间序列、条形图、蜡烛图、饼图)。
- 使用 Grafana 的查询生成器或编写 SQL 查询,从 Manticore Search 表中获取数据。
- 根据需要自定义图表的外观、标签和其他设置。
- 点击“应用”,将您的可视化保存至仪表盘。
以下是一个使用时间序列数据的简单示例。首先,创建表并加载示例数据:
CREATE TABLE btc_usd_trading (
  id bigint,
  time timestamp,
  open float,
  high float,
  low float,
  close float
);
加载数据:
curl -sSL https://gist.githubusercontent.com/donhardman/df109ba6c5e690f73198b95f3768e73f/raw/0fab3aee69d7007fad012f4e97f38901a64831fb/btc_usd_trading.sql | mysql -h0 -P9306
在 Grafana 中,您可以创建:
- 时间序列图表:可视化价格随时间的变化
- 蜡烛图:显示金融数据的开盘价、最高价、最低价、收盘价
- 聚合图表:使用 COUNT、AVG、MAX、MIN 函数
示例查询:
-- Time series query
SELECT time, close FROM btc_usd_trading ORDER BY time;
-- Aggregation query
SELECT DATE(time) as date, AVG(close) as avg_price
FROM btc_usd_trading
GROUP BY date
ORDER BY date;
通过 Grafana 使用 Manticore Search,您可以:
- 对 Manticore Search 表执行 SQL 查询
- 使用聚合函数:COUNT、AVG、MAX、MIN
- 应用 GROUP BY 和 ORDER BY 操作
- 使用 WHERE 子句过滤数据
- 通过
information_schema.tables 访问表元数据
- 创建 Grafana 支持的各种可视化类型
- 在通过 Grafana 使用 Manticore Search 时,某些高级 MySQL 功能可能不可用。
- 仅支持 Manticore Search 支持的功能。详细信息请参阅SQL 参考。
更多信息和详细教程: