ПРИМЕЧАНИЕ: Некоторые панели и метрики на дашбордах требуют Manticore Buddy. Если некоторые панели остаются пустыми, убедитесь, что Buddy установлен.
Grafana — это платформа с открытым исходным кодом для визуализации данных и мониторинга, которая позволяет создавать интерактивные дашборды и диаграммы. Manticore Search может интегрироваться с Grafana двумя основными способами:
- Мониторинг производительности Manticore: Использование Prometheus для сбора метрик от Manticore и их визуализации в дашбордах Grafana. Этот подход фокусируется на состоянии системы, мониторинге производительности и оповещениях для самого поискового движка.
- Визуализация поисковых данных: Подключение через коннектор MySQL для запросов и отображения данных, хранящихся в таблицах Manticore, аналогично тому, как Kibana используется для визуализации данных Elasticsearch. Это идеально подходит для анализа тенденций, агрегаций и создания пользовательских визуализаций на основе ваших индексированных данных.
В настоящее время протестированы и поддерживаются версии Grafana 10.0-12.4.
Manticore предоставляет предварительно собранный дашборд Grafana и правила оповещений Prometheus в специальном репозитории manticoresoftware/grafana-dashboard. Репозиторий также включает в себя универсальный Docker-образ с Grafana и Prometheus для быстрого старта. Эти ресурсы можно использовать независимо с вашей существующей настройкой Grafana и Prometheus, что позволяет отслеживать операционные метрики Manticore — такие как задержка, использование ресурсов и ошибки — без необходимости запускать отдельный экземпляр.
Для полностью предварительно настроенной конфигурации запустите единый Docker-образ с Grafana и Prometheus, адаптированный для мониторинга Manticore. Этот вариант идеален, если у вас нет существующей настройки или вы хотите быстро создать тестовое окружение:
docker run -e MANTICORE_TARGETS=localhost:9308 -p 127.0.0.1:3000:3000 manticoresearch/dashboard:latest
MANTICORE_TARGETS — это список HTTP-эндпоинтов Manticore, разделенных запятыми, в формате хост:порт (например: localhost:9308,10.0.0.5:9308).
Если у вас уже запущены собственные Grafana и Prometheus, вы можете пропустить образ Docker и напрямую импортировать дашборд и правила оповещений, как описано ниже.
Чтобы добавить дашборд Manticore в вашу существующую инсталляцию Grafana:
- В Grafana перейдите в Дашборды → Создать → Импортировать.
- Загрузите файл manticore-dashboard.json (или вставьте его JSON-содержимое).
- При запросе выберите ваш источник данных Prometheus.
- При необходимости проверьте и настройте переменную дашборда
job (по умолчанию ожидается значение метки manticoresearch).
Для интеграции правил оповещений Manticore в вашу существующую систему Prometheus:
- Скачайте файл manticore-alerts.yml и добавьте его в конфигурацию
rule_files вашего Prometheus.
- Если имя вашего задания для сбора метрик (scrape job) отличается от
manticoresearch, обновите селекторы {job="manticoresearch"} в правилах соответствующим образом.
- Перезагрузите или перезапустите Prometheus, чтобы применить изменения.
Файл manticore-alerts.yml разработан для отслеживания ключевых сигналов, связанных с доступностью, перегрузкой и истощением ресурсов — проблем, которые часто напрямую влияют на пользователей. Пороговые значения установлены как безопасные по умолчанию; настройте их в соответствии с вашей конкретной нагрузкой.
- ManticoreTargetDown (
critical): Prometheus не может собрать метрики Manticore (up == 0 в течение 2 минут). Обычно это означает, что конечная точка метрик недоступна, недостижима или конфигурация сбора неверна.
- ManticoreRecentlyRestarted (
warning): Время работы остается ниже 5 минут в течение 5 минут. Часто сигнализирует о нестабильности, такой как циклы сбоев, убийства из-за нехватки памяти (OOM) или перезапуски оркестратором.
- ManticoreMaxedOutErrors (
warning): manticore_maxed_out_error_count увеличивается за последние 5 минут. Manticore отклоняет запросы из-за достижения пределов емкости, параллелизма или ресурсов.
- ManticoreSearchLatencyP95High (
warning): P95 задержка поиска превышает 500 мс в течение 10 минут. Многие пользователи могут воспринимать поиск как медленный.
- ManticoreSearchLatencyP99High (
critical): P99 задержка поиска превышает 1000 мс в течение 10 минут. Хвостовая задержка сильно повышена, что указывает на очень медленные запросы в наихудшем случае.
- ManticoreWorkQueueBacklog (
warning): Длина очереди задач превышает 100 в течение 5 минут. Запросы накапливаются, что часто приводит к увеличению задержки.
- ManticoreWorkersSaturated (
warning): Более 90% рабочих потоков активны в течение 10 минут. Рабочие потоки приближаются к полной загрузке, что, вероятно, вызывает более высокую задержку и очередь.
- ManticoreQueryCacheNearLimit (
warning): Использование кэша запросов превышает 90% от настроенного максимума в течение 10 минут. Это увеличивает риск вытеснения и обновления кэша, потенциально замедляя запросы; рассмотрите возможность увеличения кэша или оптимизации шаблонов запросов.
- ManticoreAgentRetryCountHigh (
warning): manticore_agent_retry_count увеличивается более чем на 10 за 5 минут. Обычно указывает на проблемы с подключением к удаленным агентам (например, сетевые проблемы, таймауты или сбои в распределенных запросах).
- ManticoreCurrentConnectionsHigh (
warning): Текущие подключения превышают 500 в течение 10 минут. Это может указывать на всплеск трафика, утечки подключений или медленных клиентов.
- ManticoreSlowestThreadHigh (
warning): manticore_slowest_thread_seconds превышает 30 секунд в течение 10 минут. Присутствуют долго выполняющиеся или зависшие запросы; исследуйте медленные запросы и конкуренцию за ресурсы.
- ManticoreConnectTimeHigh (
warning): manticore_connect_time_seconds превышает 0,2 секунды в течение 5 минут. Установка соединения задерживается (например, из-за сетевых проблем, накладных расходов TLS или перегрузки сервера).
- ManticoreSearchdCrashesRecently (
critical): manticore_searchd_crashes_total увеличивается за последние 10 минут. Произошел сбой; проверьте логи, дампы памяти и события OOM.
- ManticoreBinlogFilesHigh (
warning): Количество файлов бинарного лога превышает 1000 в течение 10 минут. Это говорит о том, что бинарные логи не ротируются или не очищаются должным образом; проверьте настройки бинарного лога и использование диска.
- ManticoreSearchdFdCountHigh (
warning): Количество файловых дескрипторов searchd превышает 4096 в течение 10 минут. Это грозит достижением ограничений ОС; проверьте ulimit -n, подключения, открытые файлы и возможные утечки.
- ManticoreBuddyFdCountHigh (
warning): Количество файловых дескрипторов Buddy превышает 4096 в течение 10 минут. Аналогично предыдущему, но для процесса Buddy.
- ManticoreSearchdAnonRssHigh (
warning): Анонимная RSS searchd превышает 8 ГБ в течение 10 минут. Высокое использование памяти, не связанной с файлами; изучите рост памяти, шаблоны запросов/индексов и ограничения контейнера.
- ManticoreBuddyAnonRssHigh (
warning): Анонимная RSS Buddy превышает 8 ГБ в течение 10 минут. Повышенное использование памяти Buddy; проверьте логи Buddy и рабочую нагрузку.
- ManticoreNonServedTables (
warning): Одна или несколько таблиц, перечисленных в manticore.json, отсутствуют в SHOW TABLES в течение 10 минут. Обычно это означает, что таблицы не загрузились или были удалены/перемещены; проверьте логи запуска и пути к таблицам.
- ManticoreDiskMappedCacheLow (
warning): Коэффициент дискового отображенного кэша падает ниже 50% в течение 15 минут. Вероятно увеличение дискового ввода-вывода, что потенциально замедляет поиск, если рабочий набор превышает оперативную память.
- ManticoreDiskMappedCacheVeryLow (
critical): Коэффициент дискового отображенного кэша падает ниже 20% в течение 15 минут. Серьезные промахи кэша; ожидайте интенсивного дискового ввода-вывода и высокой задержки.
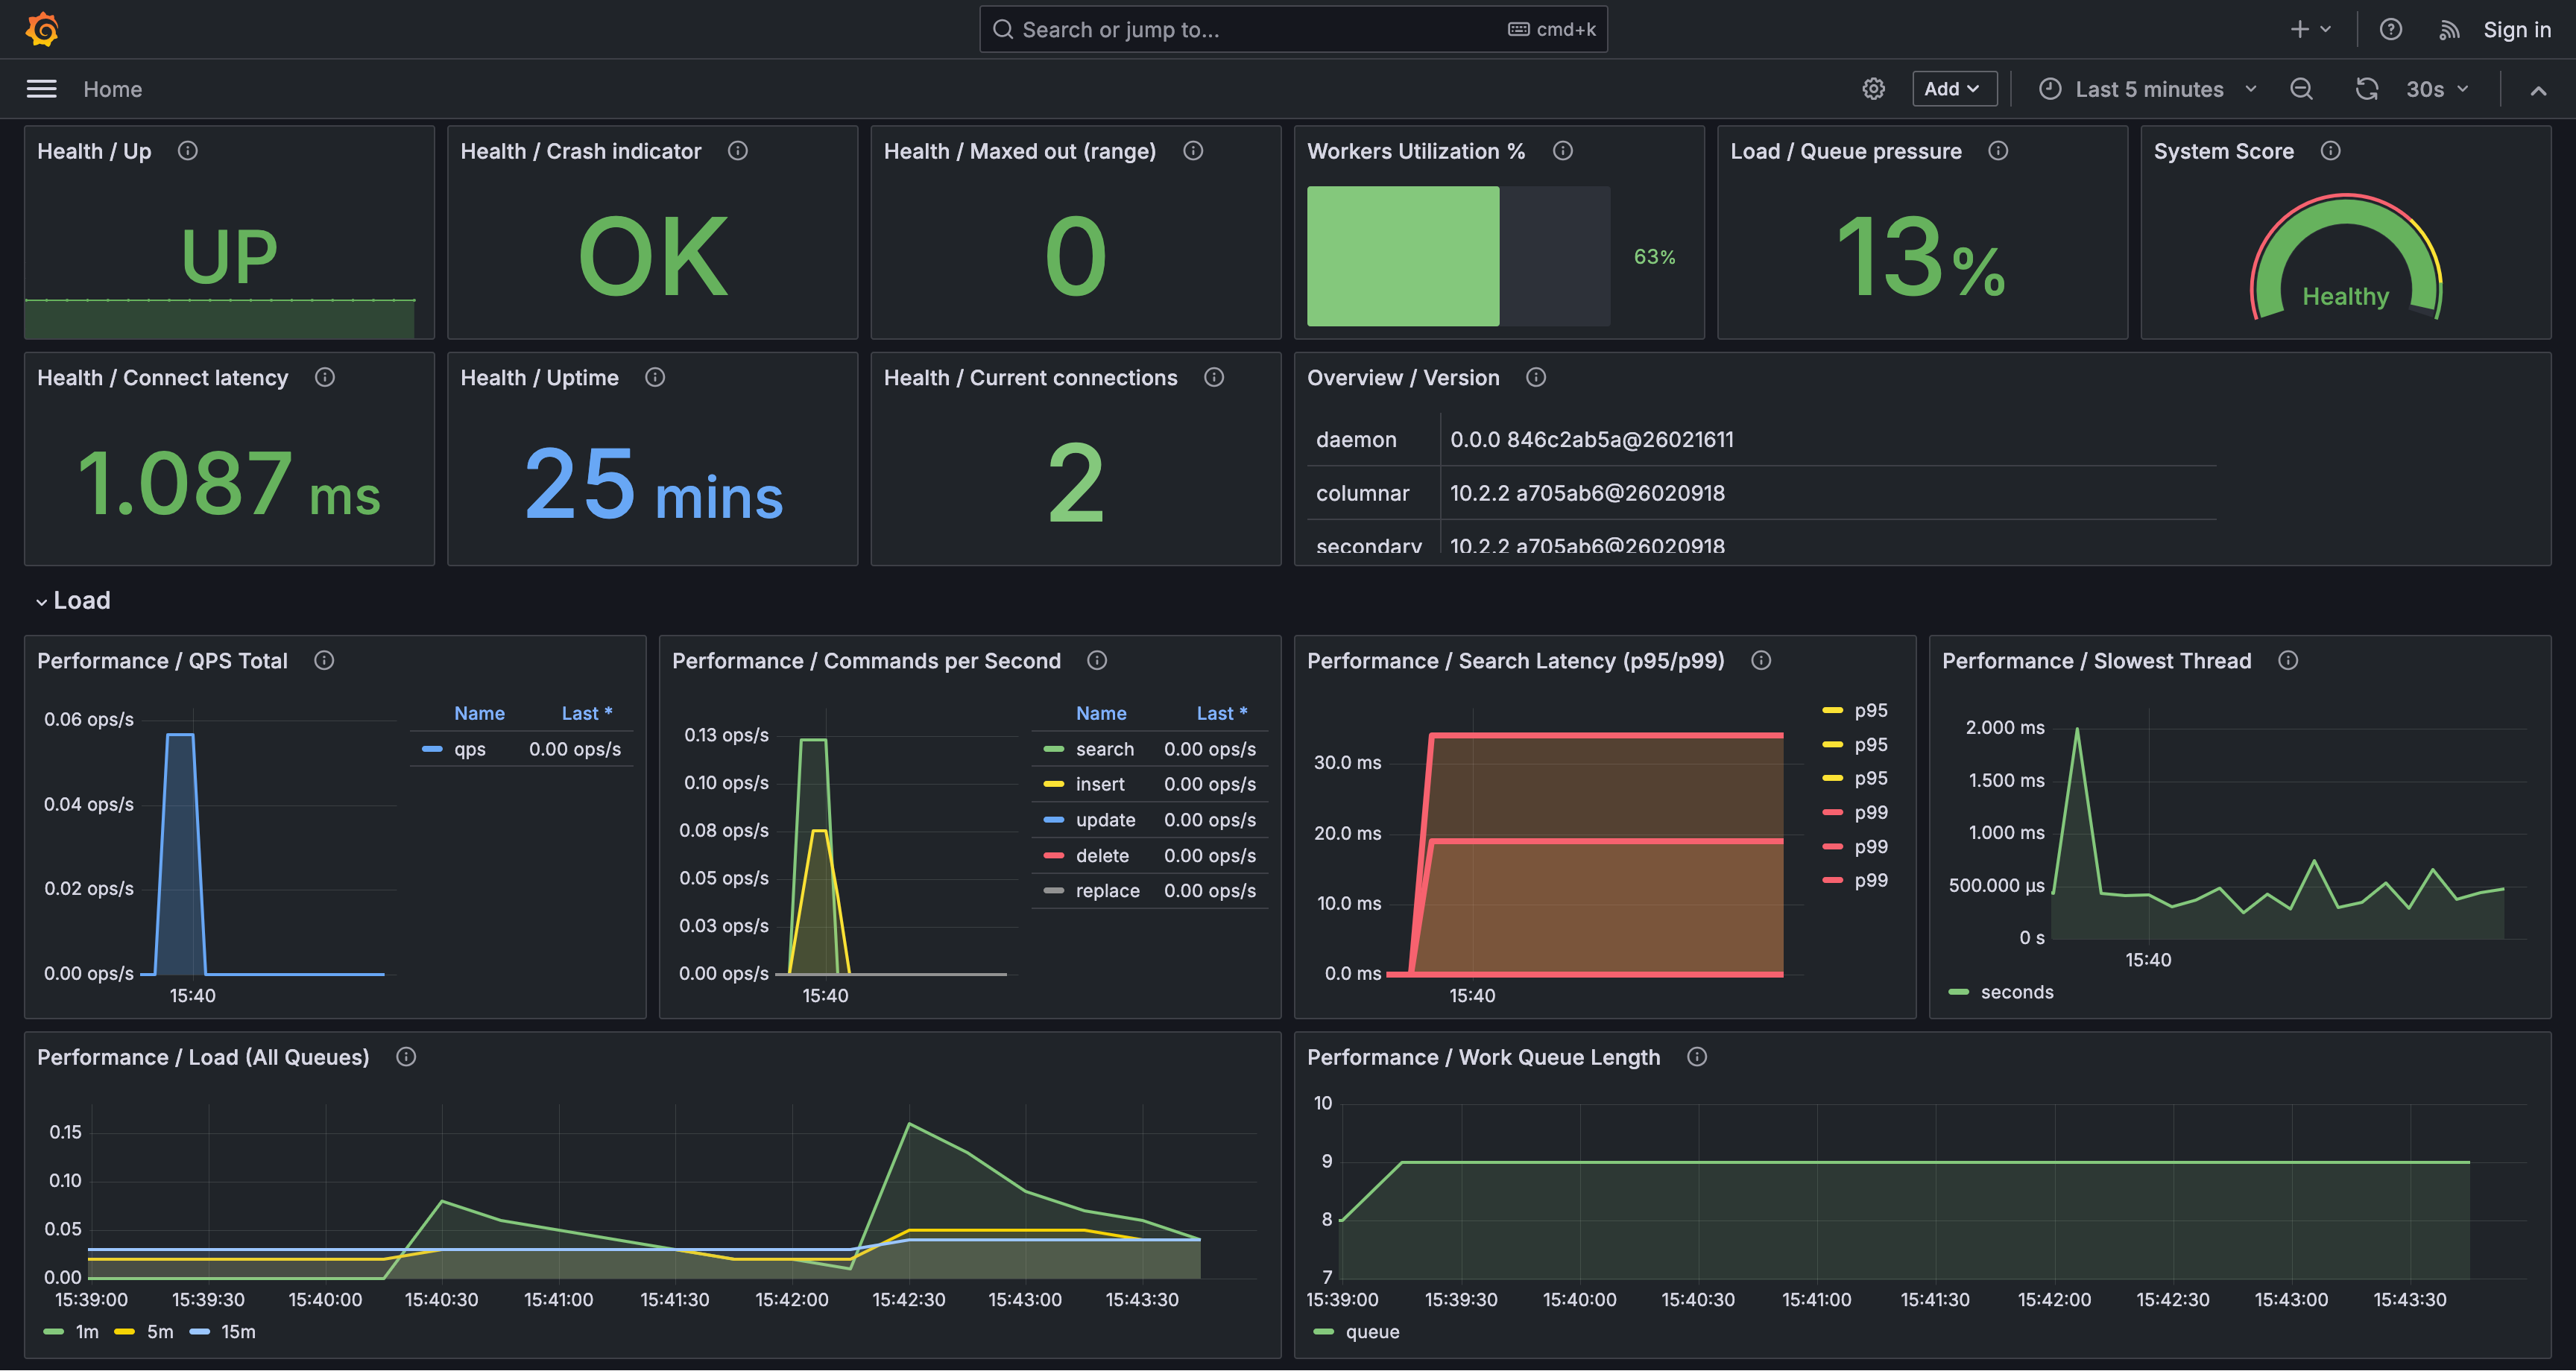
Дашборд организует панели по темам. Ключевые моменты включают:
- Здоровье / Время работы: Время с последнего перезапуска; частые падения указывают на перезапуски или сбои.
- Производительность / Задержка поиска (P95/P99): Метрики хвостовой задержки; постоянные увеличения часто сигнализируют о перегрузке или медленных запросах.
- Производительность / Длина очереди задач и Нагрузка / Давление в очереди: Индикаторы накопления и очереди; растущие очереди предполагают, что система отстает.
- Утилизация рабочих потоков % и Нагрузка / Активные/Всего рабочих потоков: Уровень загрузки рабочих потоков; значения, близкие к 100%, обычно коррелируют с более высокой задержкой.
- Производительность / Использование кэша запросов и Производительность / Коэффициент попаданий в кэш запросов: Нагрузка и эффективность кэша; высокое использование при низком коэффициенте попаданий может указывать на неэффективность.
- Таблицы / Коэффициент дискового отображенного кэша (Худшие 10): Низкие коэффициенты подразумевают больше дисковых чтений и потенциально более медленные запросы.
Этот подход использует коннектор MySQL Grafana для прямого запроса таблиц Manticore, позволяя визуализировать ваши поисковые данные, такие как временные тренды или агрегации.
Перед настройкой визуализации данных:
- Убедитесь, что Manticore Search (версия 6.2.0 или новее) установлена и настроена. Подробности см. в официальном руководстве по установке Manticore Search.
- Установите Grafana на вашу систему. Обратитесь к официальному руководству по установке Grafana для получения инструкций.
Чтобы подключить Manticore Search к Grafana:
- Войдите в свою панель управления Grafana и нажмите на «Configuration» (иконка шестерёнки) в левой боковой панели.
- Выберите «Data Sources» и нажмите «Add data source».
- Выберите «MySQL» из списка доступных источников данных.
- На странице настроек укажите следующие данные:
- Name: Название источника данных (например, «Manticore Search»)
- Host: Имя хоста или IP адрес сервера Manticore Search (с портом MySQL, по умолчанию:
localhost:9306)
- Database: Оставьте пустым или укажите имя вашей базы данных
- User: Имя пользователя, имеющего доступ к Manticore Search (по умолчанию:
root)
- Password: Пароль для указанного пользователя (по умолчанию: пустой)
- Нажмите «Save & Test», чтобы проверить подключение.
После подключения Manticore Search к Grafana вы можете создавать панели и визуализации:
- В панели Grafana нажмите на значок «+» в левой боковой панели и выберите «New dashboard».
- Нажмите кнопку «Add visualization», чтобы начать настройку графика.
- Выберите источник данных Manticore Search, который вы подключили через MySQL-коннектор.
- Выберите тип графика, который хотите создать (например, Time Series, Bar chart, Candlestick, Pie chart).
- Используйте конструктор запросов Grafana или напишите SQL-запрос для получения данных из таблиц Manticore Search.
- Настройте внешний вид графика, подписи и другие параметры по необходимости.
- Нажмите «Apply», чтобы сохранить визуализацию на панели.
Вот простой пример с данными временных рядов. Сначала создайте таблицу и загрузите пример данных:
CREATE TABLE btc_usd_trading (
  id bigint,
  time timestamp,
  open float,
  high float,
  low float,
  close float
);
Загрузите данные:
curl -sSL https://gist.githubusercontent.com/donhardman/df109ba6c5e690f73198b95f3768e73f/raw/0fab3aee69d7007fad012f4e97f38901a64831fb/btc_usd_trading.sql | mysql -h0 -P9306
В Grafana вы можете создавать:
- График временных рядов: Визуализировать изменения цен со временем
- Свечный график: Отображать значения открытия, максимума, минимума и закрытия для финансовых данных
- Агрегационные графики: Использовать функции COUNT, AVG, MAX, MIN
Примеры запросов:
-- Time series query
SELECT time, close FROM btc_usd_trading ORDER BY time;
-- Aggregation query
SELECT DATE(time) as date, AVG(close) as avg_price
FROM btc_usd_trading
GROUP BY date
ORDER BY date;
При работе с Manticore Search через Grafana вы можете:
- Выполнять SQL-запросы к таблицам Manticore Search
- Использовать агрегатные функции: COUNT, AVG, MAX, MIN
- Применять операции GROUP BY и ORDER BY
- Фильтровать данные с помощью WHERE
- Получать метаданные таблиц через
information_schema.tables
- Создавать различные типы визуализаций, поддерживаемые Grafana
- Некоторые продвинутые функции MySQL могут быть недоступны при работе с Manticore Search через Grafana.
- Доступны только функции, поддерживаемые Manticore Search. Подробнее смотрите в справочнике по SQL.
Для получения дополнительной информации и подробных инструкций: