NOTE: Some dashboard panels and metrics require Manticore Buddy. If some panels appear empty, ensure that Buddy is installed.
Grafana is an open-source platform for data visualization and monitoring that enables the creation of interactive dashboards and charts. Manticore Search can integrate with Grafana in two primary ways:
- Monitoring Manticore Performance: Using Prometheus to collect metrics from Manticore and visualize them in Grafana dashboards. This approach focuses on system health, performance monitoring, and alerting for the search engine itself.
- Visualizing Search Data: Connecting via the MySQL connector to query and display data stored in Manticore tables, similar to how Kibana is used for Elasticsearch data visualization. This is ideal for analyzing trends, aggregations, and custom visualizations based on your indexed data.
Currently, Grafana versions 10.0-13.1 are tested and supported.
Manticore provides a prebuilt Grafana dashboard and Prometheus alerting rules in the dedicated repository manticoresoftware/grafana-dashboard. The repository also includes an all-in-one Docker image with Grafana and Prometheus for a quick start. These resources can be used independently with your existing Grafana and Prometheus setup, allowing you to monitor Manticore's operational metrics—such as latency, resource usage, and errors—without needing to run a separate instance.
- Additional screenshots: https://github.com/manticoresoftware/grafana-dashboard
- Dashboard JSON: grafana/dashboards/manticore-dashboard.json
- Alert rules (Prometheus/Alertmanager): prometheus/rules/manticore-alerts.yml
For a fully preconfigured setup, run the all-in-one Docker image with Grafana and Prometheus tailored for Manticore monitoring. This is ideal if you don't have an existing setup or want a quick test environment:
docker run -e MANTICORE_TARGETS=localhost:9308 -p 127.0.0.1:3000:3000 manticoresearch/dashboard:latestMANTICORE_TARGETS is a comma-separated list of Manticore http endpoints in the host:port format (for example: localhost:9308,10.0.0.5:9308).
If you already have your own Grafana and Prometheus running, you can skip the Docker image and directly import the dashboard and alert rules as described below.
To add the Manticore dashboard to your existing Grafana instance:
- In Grafana, navigate to Dashboards → New → Import.
- Upload the manticore-dashboard.json file (or paste its JSON content).
- Select your Prometheus data source when prompted.
- Verify and adjust the
jobdashboard variable if needed (the default expected label value ismanticoresearch).
To integrate the Manticore alert rules into your existing Prometheus setup:
- Download manticore-alerts.yml and add it to your Prometheus
rule_filesconfiguration. - If your scrape job name differs from
manticoresearch, update the{job="manticoresearch"}matchers in the rules accordingly. - Reload or restart Prometheus to apply the changes.
The manticore-alerts.yml file is designed to focus on key signals related to availability, overload, and resource exhaustion—issues that often impact users directly. Thresholds are set as safe defaults; adjust them based on your specific workload.
- ManticoreTargetDown (
critical): Prometheus fails to scrape Manticore (up == 0for 2 minutes). This typically indicates the metrics endpoint is down, unreachable, or the scrape configuration is incorrect. - ManticoreRecentlyRestarted (
warning): Uptime remains below 5 minutes for 5 minutes. This often signals instability, such as crash loops, OOM kills, or orchestrator restarts. - ManticoreMaxedOutErrors (
warning):manticore_maxed_out_error_countincreases over the last 5 minutes. Manticore is rejecting requests due to hitting capacity, concurrency, or resource limits. - ManticoreSearchLatencyP95High (
warning): P95 search latency exceeds 500 ms for 10 minutes. Many users may perceive searches as slow. - ManticoreSearchLatencyP99High (
critical): P99 search latency exceeds 1,000 ms for 10 minutes. Tail latency is severely elevated, indicating very slow worst-case requests. - ManticoreWorkQueueBacklog (
warning): Work queue length exceeds 100 for 5 minutes. Requests are accumulating, which often leads to increased latency. - ManticoreWorkersSaturated (
warning): More than 90% of workers are active for 10 minutes. Worker threads are nearing full capacity, likely causing higher latency and queueing. - ManticoreQueryCacheNearLimit (
warning): Query cache usage exceeds 90% of its configured maximum for 10 minutes. This increases the risk of cache churn and evictions, potentially slowing queries; consider expanding the cache or optimizing query patterns. - ManticoreAgentRetryCountHigh (
warning):manticore_agent_retry_countincreases by more than 10 in 5 minutes. This usually points to connectivity issues with remote agents (e.g., network problems, timeouts, or failures in distributed queries). - ManticoreCurrentConnectionsHigh (
warning): Current connections exceed 500 for 10 minutes. This could indicate a traffic surge, connection leaks, or slow clients. - ManticoreSlowestThreadHigh (
warning):manticore_slowest_thread_secondsexceeds 30 seconds for 10 minutes. Long-running or stuck queries are present; investigate slow queries and resource contention. - ManticoreConnectTimeHigh (
warning):manticore_connect_time_secondsexceeds 0.2 seconds for 5 minutes. Connection establishment is delayed (e.g., due to network issues, TLS overhead, or server overload). - ManticoreSearchdCrashesRecently (
critical):manticore_searchd_crashes_totalincreases in the last 10 minutes. A crash has occurred; review logs, core dumps, and OOM events. - ManticoreBinlogFilesHigh (
warning): Binlog file count exceeds 1,000 for 10 minutes. This suggests binlogs are not rotating or cleaning properly; check binlog settings and disk usage. - ManticoreSearchdFdCountHigh (
warning):searchdfile descriptor count exceeds 4,096 for 10 minutes. This risks hitting OS limits; verifyulimit -n, connections, open files, and potential leaks. - ManticoreBuddyFdCountHigh (
warning): Buddy file descriptor count exceeds 4,096 for 10 minutes. Similar to the above, but for the Buddy process. - ManticoreSearchdAnonRssHigh (
warning):searchdanonymous RSS exceeds 8 GiB for 10 minutes. High non-file-backed memory usage; examine memory growth, query/index patterns, and container limits. - ManticoreBuddyAnonRssHigh (
warning): Buddy anonymous RSS exceeds 8 GiB for 10 minutes. Elevated Buddy memory usage; review Buddy logs and workload. - ManticoreNonServedTables (
warning): One or more tables listed inmanticore.jsonare missing fromSHOW TABLESfor 10 minutes. This typically means tables failed to load or were dropped/moved; check startup logs and table paths. - ManticoreDiskMappedCacheLow (
warning): Disk mapped cache ratio falls below 50% for 15 minutes. Increased disk I/O is likely, potentially slowing searches if the working set exceeds RAM. - ManticoreDiskMappedCacheVeryLow (
critical): Disk mapped cache ratio falls below 20% for 15 minutes. Severe cache misses; anticipate heavy disk I/O and high latency.
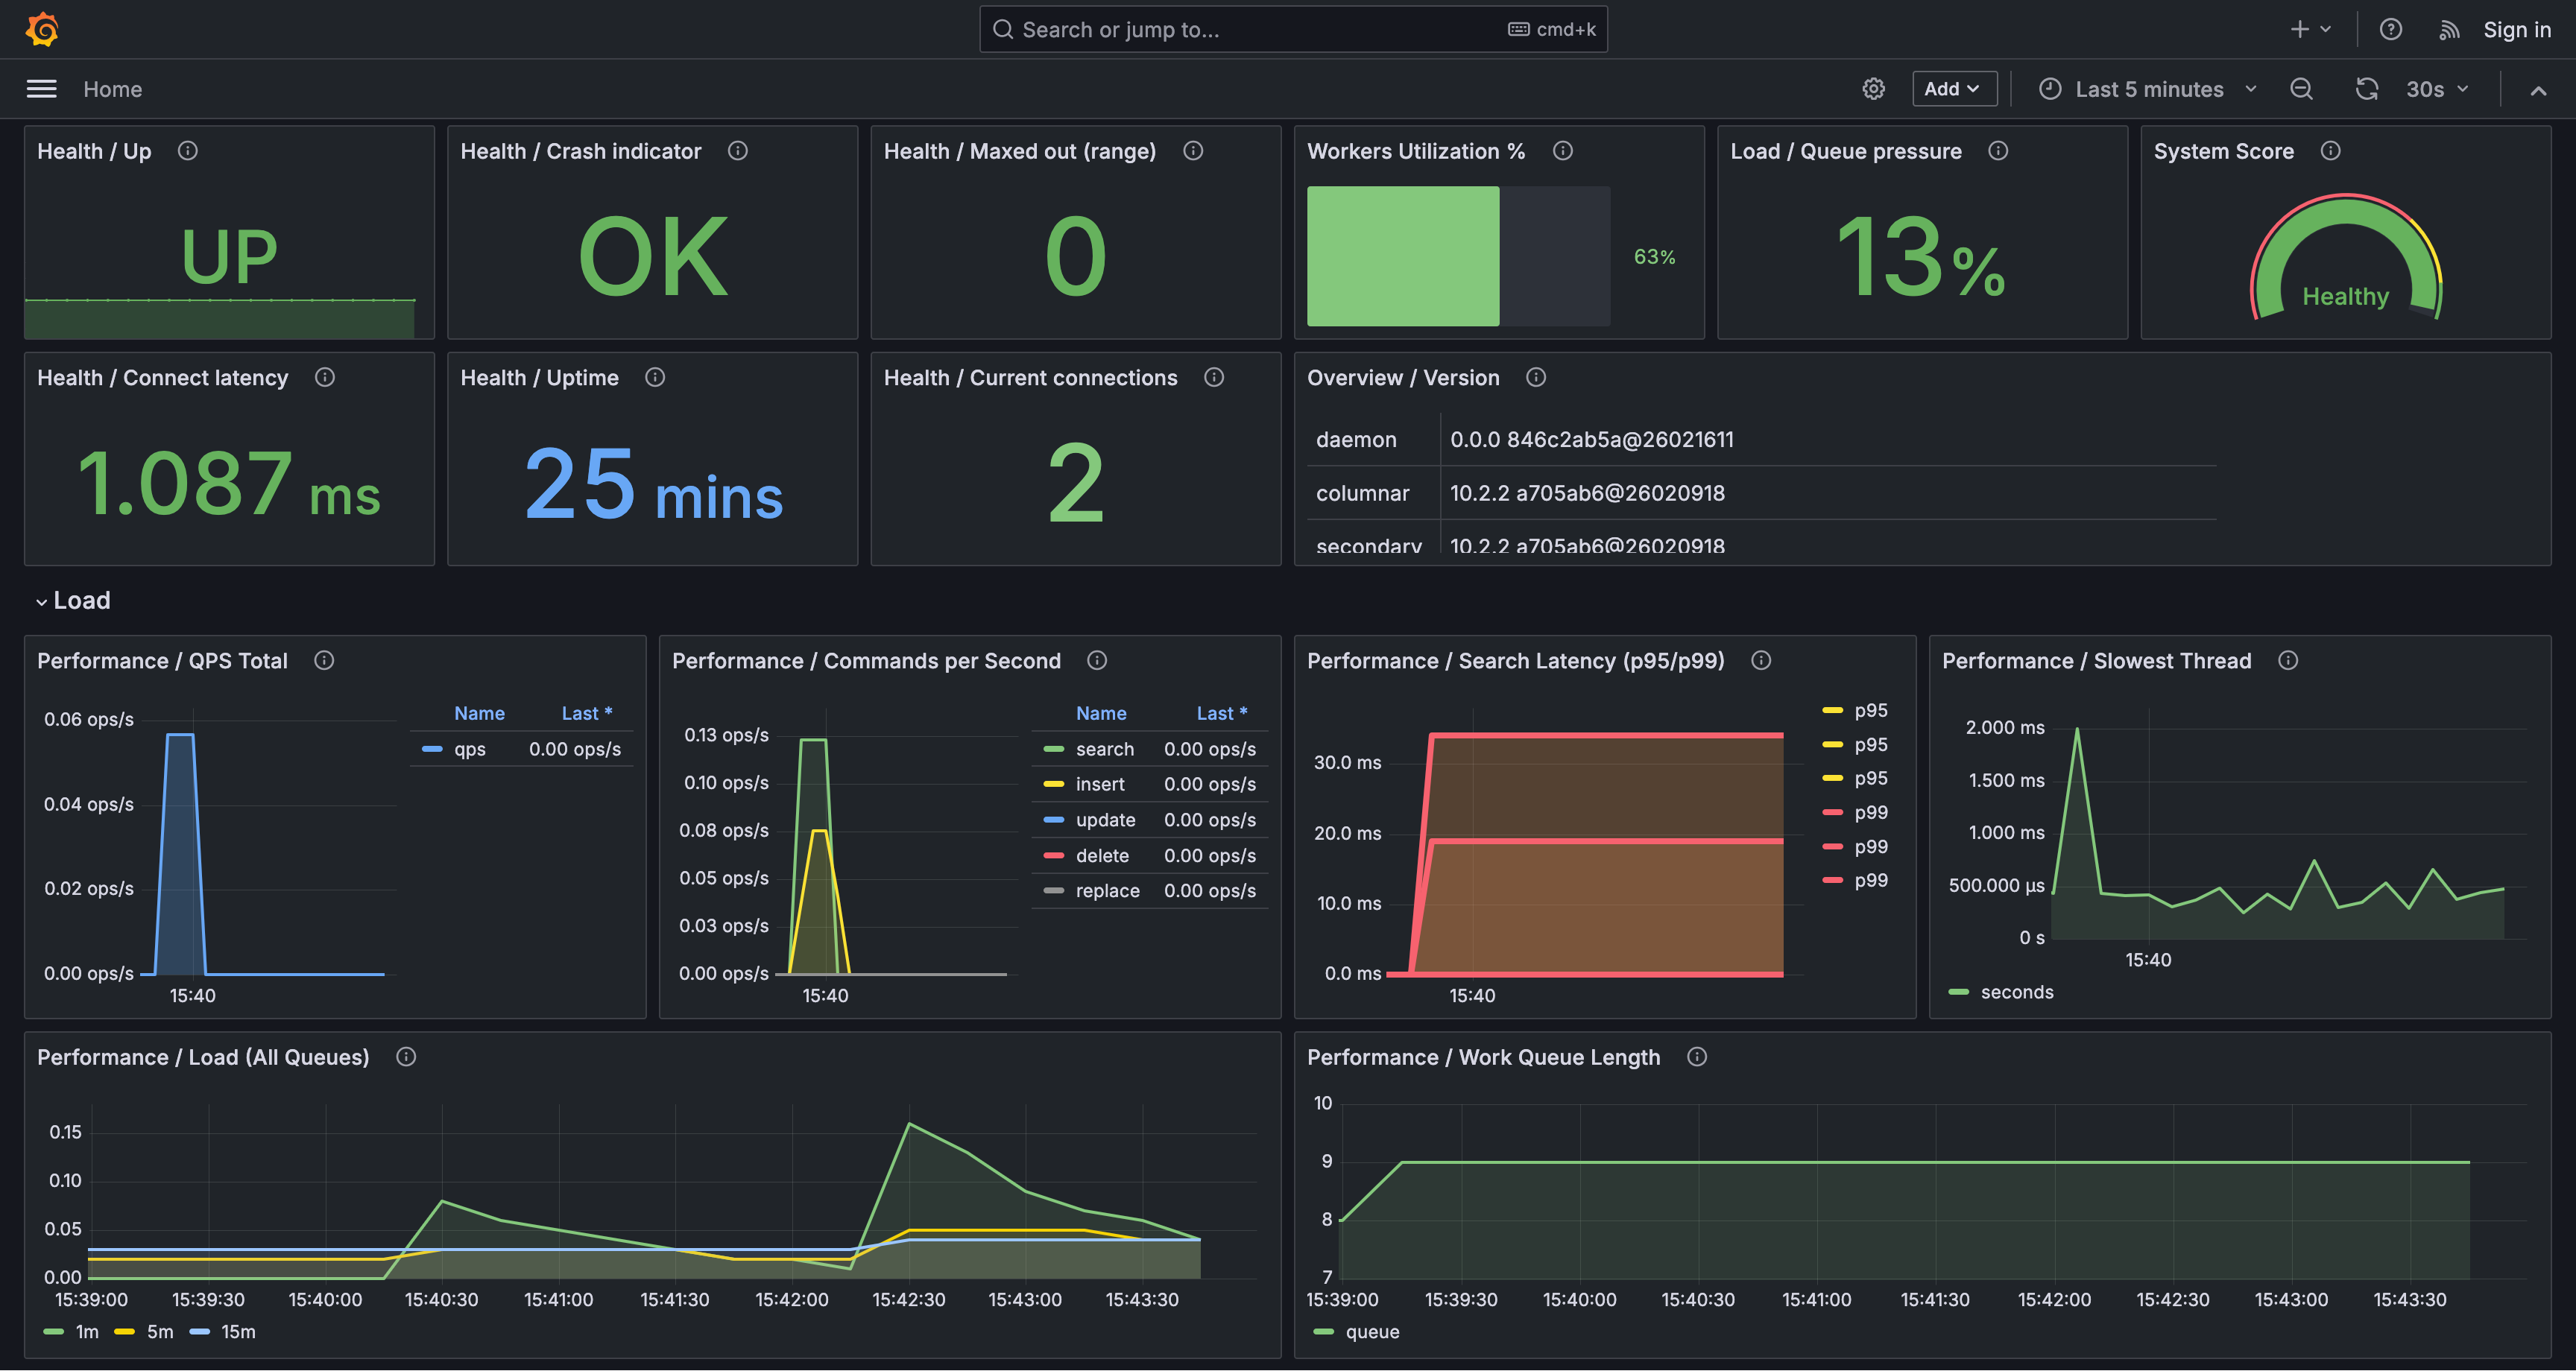
The dashboard organizes panels by topic. Key highlights include:
- Health / Uptime: Time since the last restart; frequent drops indicate restarts or crashes.
- Performance / Search Latency (P95/P99): Tail latency metrics; persistent increases often signal overload or slow queries.
- Performance / Work Queue Length and Load / Queue Pressure: Backlog and queueing indicators; growing queues suggest the system is lagging.
- Workers Utilization % and Load / Workers Active/Total: Worker saturation levels; values near 100% typically correlate with higher latency.
- Performance / Query Cache Usage and Performance / Query Cache Hit Rate: Cache pressure and effectiveness; high usage with low hit rates may indicate inefficiency.
- Tables / Disk Mapped Cache Ratio (Worst 10): Low ratios imply more disk reads and potentially slower queries.
This approach uses Grafana's MySQL connector to directly query Manticore tables, enabling visualizations of your search data, such as time-series trends or aggregations.
Before setting up data visualization:
- Ensure Manticore Search (version 6.2.0 or later) is installed and configured. See the official Manticore Search installation guide for details.
- Install Grafana on your system. Refer to the official Grafana installation guide for instructions.
To connect Manticore Search to Grafana:
- Log in to your Grafana dashboard and click on "Configuration" (the gear icon) in the left sidebar.
- Select "Data Sources" and click on "Add data source."
- Choose "MySQL" from the list of available data sources.
- In the settings page, provide the following details:
- Name: A name for the data source (e.g., "Manticore Search")
- Host: The hostname or IP address of your Manticore Search server (with MySQL port, default:
localhost:9306) - Database: Leave empty or specify your database name
- User: The username with access to Manticore Search (default:
root) - Password: The password for the specified user (default: empty)
- Click on "Save & Test" to verify the connection.
After connecting Manticore Search to Grafana, you can create dashboards and visualizations:
- In the Grafana dashboard, click on the "+" icon in the left sidebar and select "New dashboard."
- Click on the "Add visualization" button to start configuring your chart.
- Choose the Manticore Search data source that you connected via the MySQL connector.
- Select the type of chart you want to create (e.g., Time Series, Bar chart, Candlestick, Pie chart).
- Use Grafana's query builder or write an SQL query to fetch data from your Manticore Search tables.
- Customize the chart's appearance, labels, and other settings as needed.
- Click "Apply" to save your visualization to the dashboard.
Here's a simple example using time-series data. First, create a table and load sample data:
CREATE TABLE btc_usd_trading (
  id bigint,
  time timestamp,
  open float,
  high float,
  low float,
  close float
);
Load the data:
curl -sSL https://gist.githubusercontent.com/donhardman/df109ba6c5e690f73198b95f3768e73f/raw/0fab3aee69d7007fad012f4e97f38901a64831fb/btc_usd_trading.sql | mysql -h0 -P9306In Grafana, you can create:
- Time Series chart: Visualize price changes over time
- Candlestick chart: Display open, high, low, close values for financial data
- Aggregation charts: Use COUNT, AVG, MAX, MIN functions
Example queries:
-- Time series query
SELECT time, close FROM btc_usd_trading ORDER BY time;
-- Aggregation query
SELECT DATE(time) as date, AVG(close) as avg_price
FROM btc_usd_trading
GROUP BY date
ORDER BY date;When working with Manticore Search through Grafana, you can:
- Execute SQL queries against Manticore Search tables
- Use aggregation functions: COUNT, AVG, MAX, MIN
- Apply GROUP BY and ORDER BY operations
- Filter data with WHERE clauses
- Access table metadata via
information_schema.tables - Create various visualization types supported by Grafana
- Some advanced MySQL features may not be available when working with Manticore Search through Grafana.
- Only features supported by Manticore Search are available. Refer to the SQL reference for details.
For more information and detailed tutorials: