At Manticore, we gather various anonymized metrics in order to enhance the quality of our products, including Manticore Search. By analyzing this data, we can not only improve the overall performance of our product, but also identify which features would be most beneficial to prioritize in order to provide even more value to our users. The telemetry system operates on a separate thread in non-blocking mode, taking snapshots and sending them once every few minutes.
We take your privacy seriously, and you can be assured that all metrics are completely anonymous and no sensitive information is transmitted. However, if you still wish to disable telemetry, you can do so by:
- setting the environment variable
TELEMETRY=0 - or setting
telemetry = 0in the sectionsearchdof your configuration file
Here's a list of all the metrics we collect:
| Metric | Description |
|---|---|
| collector | 🏷 buddy. Indicates that this metric comes through Manticore Buddy |
| os_name | 🏷️ Name of the operating system |
| machine_id | 🏷 Server identifier (the content of /etc/machine-id in Linux) |
| manticore_version | 🏷️ Version of Manticore |
| columnar_version | 🏷️ Version of Columnar lib if it is installed |
| secondary_version | 🏷️ Version of the secondary lib if the Columnar lib is installed |
| buddy_version | 🏷️ Version of the Buddy |
| invocation | Sent when the Buddy is launched |
| show_queries | Indicates that the show queries command was executed |
| backup | Indicates that the backup query was executed |
| insert_query | Indicates that the auto schema logic was executed |
| command_* | All metrics with this prefix are sent from the show status query of the manticore daemon |
| uptime | The uptime of the manticore search daemon |
| workers_total | The number of workers that Manticore uses |
| cluster_* | Cluster-related metrics from the show status results |
| table_*_count | The number of tables created for each type: plain, percolate, rt, or distributed |
| field_count | The count for each field type for tables with rt and percolate types |
| columnar | Indicates that the columnar lib was used |
| columnar_field_count | The number of fields that use the columnar lib |
The Manticore backup tool sends anonymized metrics to the Manticore metrics server by default in order to help the maintainers improve the product. If you wish to disable telemetry, you can do so by running the tool with the --disable-metric flag or by setting the environment variable TELEMETRY=0.
Below is a list of all metrics that we collect:
| Metric | Description |
|---|---|
| collector | 🏷 backup. Means this metric comes from the backup tool |
| os_name | 🏷️ Name of the operating system |
| machine_id | 🏷 Server identifier (the content of /etc/machine-id in Linux) |
| backup_version | 🏷️ Version of the backup tool that was used |
| manticore_version | 🏷️ Version of Manticore |
| columnar_version | 🏷️ Version of Columnar lib if it is installed |
| secondary_version | 🏷️ Version of the secondary lib if the Columnar lib is installed |
| invocation | Sent when backup was invoked |
| failed | Sent in the event of a failed backup |
| done | Sent when the backup/restore was successful |
| arg_* | The arguments used to run the tool (excluding index names, etc.) |
| backup_store_versions_fails | Indicates a failure to save the Manticore version in the backup |
| backup_table_count | The total number of backed up tables |
| backup_no_permissions | Failed to back up due to insufficient permissions to the destination directory |
| backup_total_size | The total size of the full backup |
| backup_time | The duration of the backup |
| restore_searchd_running | Failed to run the restore process due to searchd already being running |
| restore_no_config_file | No config file found in the backup during restore |
| restore_time | The duration of the restore |
| fsync_time | The duration of the fsync |
| restore_target_exists | Occurs when there is already a folder or index in the destination folder to restore to |
| terminations | Indicates that the process was terminated |
| signal_* | The signal used to terminate the process |
| tables | The number of tables in Manticore |
| config_unreachable | The specified configuration file does not exist |
| config_data_dir_missing | Failed to parse the data_dir from the specified configuration file |
| config_data_dir_is_relative | The data_dir path in the configuration file of the Manticore instance is relative |
Released: Feb 7 2023
Starting with this release, Manticore Search comes with Manticore Buddy, a sidecar daemon written in PHP that handles high-level functionality that does not require super low latency or high throughput. Manticore Buddy operates behind the scenes, and you may not even realize it is running. Although it is invisible to the end user, it was a significant challenge to make Manticore Buddy easily installable and compatible with the main C++-based daemon. This major change will allow the team to develop a wide range of new high-level features, such as shards orchestration, access control and authentication, and various integrations like mysqldump, DBeaver, Grafana mysql connector. For now it already handles SHOW QUERIES, BACKUP and Auto schema.
This release also includes more than 130 bug fixes and numerous features, many of which can be considered major.
- 🔬 Experimental: you can now execute Elasticsearch-compatible insert and replace JSON queries which enables using Manticore with tools like Logstash (version < 7.13), Filebeat and other tools from the Beats family. Enabled by default. You can disable it using
SET GLOBAL ES_COMPAT=off. - Support for Manticore Columnar Library 2.0.0 with numerous fixes and improvements in Secondary indexes. ⚠️ BREAKING CHANGE: Secondary indexes are ON by default as of this release. Make sure you do ALTER TABLE table_name REBUILD SECONDARY if you are upgrading from Manticore 5. See below for more details.
- Commit c436 Auto-schema: you can now skip creating a table, just insert the first document and Manticore will create the table automatically based on its fields. Read more about this in detail here. You can turn it on/off using searchd.auto_schema.
- Vast revamp of cost-based optimizer which lowers query response time in many cases.
- Issue #1008 Parallelization performance estimate in CBO.
- Issue #1014 CBO is now aware of secondary indexes and can act smarter.
- Commit cef9 Encoding stats of columnar tables/fields are now stored in the meta data to help CBO make smarter decisions.
- Commit 2b95 Added CBO hints for fine-tuning its behaviour.
- Telemetry: we are excited to announce the addition of telemetry in this release. This feature allows us to collect anonymous and depersonalized metrics that will help us improve the performance and user experience of our product. Rest assured, all data collected is completely anonymous and will not be linked to any personal information. This feature can be easily turned off in the settings if desired.
- Commit 5aaf ALTER TABLE table_name REBUILD SECONDARY to rebuild secondary indexes whenever you want, for example:
- when you migrate from Manticore 5 to the newer version,
- when you did UPDATE (i.e. in-place update, not replace) of an attribute in the index
- Issue #821 New tool
manticore-backupfor backing up and restoring Manticore instance - SQL command BACKUP to do backups from inside Manticore.
- SQL command SHOW QUERIES as an easy way to see running queries rather than threads.
- Issue #551 SQL command
KILLto kill a long-runningSELECT. - Dynamic
max_matchesfor aggregation queries to increase accuracy and lower response time.
-
Issue #822 SQL commands FREEZE/UNFREEZE to prepare a real-time/plain table for a backup.
-
Commit c470 New settings
accurate_aggregationandmax_matches_increase_thresholdfor controlled aggregation accuracy. -
Issue #718 Support for signed negative 64-bit IDs. Note, you still can't use IDs > 2^63, but you can now use ids in the range of from -2^63 to 0.
-
As we recently added support for secondary indexes, things became confusing as "index" could refer to a secondary index, a full-text index, or a plain/real-time
index. To reduce confusion, we are renaming the latter to "table". The following SQL/command line commands are affected by this change. Their old versions are deprecated, but still functional:index <table name>=>table <table name>,searchd -i / --index=>searchd -t / --table,SHOW INDEX STATUS=>SHOW TABLE STATUS,SHOW INDEX SETTINGS=>SHOW TABLE SETTINGS,FLUSH RTINDEX=>FLUSH TABLE,OPTIMIZE INDEX=>OPTIMIZE TABLE,ATTACH TABLE plain TO RTINDEX rt=>ATTACH TABLE plain TO TABLE rt,RELOAD INDEX=>RELOAD TABLE,RELOAD INDEXES=>RELOAD TABLES.
We are not planning to make the old forms obsolete, but to ensure compatibility with the documentation, we recommend changing the names in your application. What will be changed in a future release is the "index" to "table" rename in the output of various SQL and JSON commands.
-
Queries with stateful UDFs are now forced to be executed in a single thread.
-
Issue #1011 Refactoring of all related to time scheduling as a prerequisite for parallel chunks merging.
-
⚠️ BREAKING CHANGE: Columnar storage format has been changed. You need to rebuild those tables that have columnar attributes.
-
⚠️ BREAKING CHANGE: Secondary indexes file format has been changed, so if you are using secondary indexes for searching and have
searchd.secondary_indexes = 1in your configuration file, be aware that the new Manticore version will skip loading the tables that have secondary indexes. It's recommended to:- Before you upgrade change
searchd.secondary_indexesto 0 in the configuration file. - Run the instance. Manticore will load up the tables with a warning.
- Run
ALTER TABLE <table name> REBUILD SECONDARYfor each index to rebuild secondary indexes.
If you are running a replication cluster, you'll need to run
ALTER TABLE <table name> REBUILD SECONDARYon all the nodes or follow this instruction with just change: run theALTER .. REBUILD SECONDARYinstead of theOPTIMIZE. - Before you upgrade change
-
⚠️ BREAKING CHANGE: The binlog version has been updated, so any binlogs from previous versions will not be replayed. It is important to ensure that Manticore Search is stopped cleanly during the upgrade process. This means that there should be no binlog files in
/var/lib/manticore/binlog/except forbinlog.metaafter stopping the previous instance. -
Issue #849
SHOW SETTINGS: helper command for manticore-backup. -
Issue #1007 SET GLOBAL CPUSTATS=1/0 turns on/off cpu time tracking; SHOW THREADS now doesn't show CPU statistics when the cpu time tracking is off.
-
Issue #1009 RT table RAM chunk segments can now be merged while the RAM chunk is being flushed.
-
Issue #1012 Added secondary index progress to the output of indexer.
-
Issue #1013 Previously a table record could be removed by Manticore from the index list if it couldn't start serving it on start. The new behaviour is to keep it in the list to try to load it on the next start.
-
indextool --docextract returns all the words and hits belonging to requested document.
-
Commit 2b29 Environment variable
dump_corrupt_metaenables dumping a corrupted table meta data to log in case searchd can't load the index. -
Commit c7a3
DEBUG METAcan showmax_matchesand pseudo sharding statistics. -
Commit 6bca A better error instead of the confusing "Index header format is not json, will try it as binary...".
-
Commit bef3 Ukirainian lemmatizer path has been changed.
-
Commit 4ae7 Secondary indexes statistics has been added to SHOW META.
-
Commit 2e7c JSON interface can now be easily visualized using Swagger Editor https://manual.manticoresearch.com/dev/Openapi#OpenAPI-specification.
- Refactoring of Secondary indexes integration with Columnar storage.
- Commit efe2 Manticore Columnar Library optimization which can lower response time by partial preliminary min/max evaluation.
- Commit 2757 If a disk chunk merge is interrupted, the daemon now cleans up the MCL-related tmp files.
- Commit e9c6 Columnar and secondary libraries versions are dumped to log on crash.
- Commit f5e8 Added support for quick doclist rewinding to secondary indexes.
- Commit 06df Queries like
select attr, count(*) from plain_index(w/o filtering) are now faster in case you are using MCL. - Commit 0a76 @@autocommit in HandleMysqlSelectSysvar for compatibility with .net connector for mysql greater than 8.25
- Commit 4d19 ⚠️ BREAKING CHANGE: Support for Debian Stretch and Ubuntu Xenial has been discontinued.
- RHEL 9 support including Centos 9, Alma Linux 9 and Oracle Linux 9.
- Issue #924 Debian Bookworm support.
- Issue #636 Packaging: arm64 builds for Linuxes and MacOS.
- PR #26 Multi-architecture (x86_64 / arm64) docker image.
- Simplified package building for contributors.
- It's now possible to install a specific version using APT.
- Commit a6b8 Windows installer (previously we provided just an archive).
- Switched to compiling using CLang 15.
- ⚠️ BREAKING CHANGE: Custom Homebrew formulas including the formula for Manticore Columnar Library. To install Manticore, MCL and any other necessary components, use the following command
brew install manticoresoftware/manticore/manticoresearch manticoresoftware/manticore/manticore-extra.
- Issue #479 Field with name
text - Issue #501 id can't be non bigint
- Issue #646 ALTER vs field with name "text"
- ❗Issue #652 Possible BUG: HTTP (JSON) offset and limit affects facet results
- ❗Issue #827 Searchd hangs/crashes under intensive loading
- ❗Issue #996 PQ index out of memory
- ❗Commit 1041
binlog_flush = 1has been broken all the time since Sphinx. Fixed. - MCL Issue #14 MCL: crash on select when too many ft fields
- MCL Issue #17 MCL: add SSE code to columnar scan
- Issue #470 sql_joined_field can't be stored
- Issue #713 Crash when using LEVENSHTEIN()
- Issue #743 Manticore crashes unexpected and cant to normal restart
- Issue #788 CALL KEYWORDS through /sql returns control char which breaks json
- Issue #789 mariadb can't create table FEDERATED
- Issue #796 WARNING: dlopen() failed: /usr/bin/lib_manticore_columnar.so: cannot open shared object file: No such file or directory
- Issue #797 Manticore crashes when search with ZONESPAN is done through api
- Issue #799 wrong weight when using multiple indexes and facet distinct
- Issue #801 SphinxQL group query hangs after SQL index reprocessing
- Issue #802 MCL: Indexer crashes in 5.0.2 and manticore-columnar-lib 1.15.4
- Issue #813 Manticore 5.0.2 FEDERATED returns empty set (MySQL 8.0.28)
- Issue #824 select COUNT DISTINCT on 2 indices when result is zero throws internal error
- Issue #826 CRASH on delete query
- Issue #843 MCL: Bug with long text field
- Issue #856 5.0.2 rtindex: Aggregate search limit behavior is not as expected
- Issue #863 Hits returned is Nonetype object even for searches that should return multiple results
- Issue #870 Crash with using Attribute and Stored Field in SELECT expression
- Issue #872 table gets invisible after crash
- Issue #877 Two negative terms in search query gives error: query is non-computable
- Issue #878 a -b -c is not working via json query_string
- Issue #886 pseudo_sharding with query match
- Issue #893 Manticore 5.0.2 min/max function doesn't work as expecting ...
- Issue #896 Field "weight" is not parsed correctly
- Issue #897 Manticore service crash upon start and keep restarting
- Issue #900 group by j.a, smth works wrong
- Issue #913 Searchd crash when expr used in ranker, but only for queries with two proximities
- Issue #916 net_throttle_action is broken
- Issue #919 MCL: Manticore crashes on query execution and other crashed during cluster recovery.
- Issue #925 SHOW CREATE TABLE outputs w/o backticks
- Issue #930 It's now possible to query Manticore from Java via JDBC connector
- Issue #933 bm25f ranking problems
- Issue #934 configless indexes frozen in watchdog on the first-load state
- Issue #937 Segfault when sorting facet data
- Issue #940 crash on CONCAT(TO_STRING)
- Issue #947 In some cases a single simple select could cause the whole instance stall, so you couldn't log in to it or run any other query until the running select is done.
- Issue #948 Indexer crash
- Issue #950 wrong count from facet distinct
- Issue #953 LCS is calculating incorrectly in built-in sph04 ranker
- Issue #955 5.0.3 dev crashing
- Issue #963 FACET with json on engine columnar crash
- Issue #982 MCL: 5.0.3 crash from secondary index
- PR #984 @@autocommit in HandleMysqlSelectSysvar
- PR #985 Fix thread-chunk distribution in RT indexes
- Issue #985 Fix thread-chunk distribution in RT indexes
- Issue #986 wrong default max_query_time
- Issue #987 Crash on when using regex expression in multithreaded execution
- Issue #988 Broken backward index compatibility
- Issue #989 indextool reports error checking columnar attributes
- Issue #990 memleak of json grouper clones
- Issue #991 Memleak of levenshtein func cloning
- Issue #992 Error message lost when loading meta
- Issue #993 Propagate errors from dynamic indexes/subkeys and sysvars
- Issue #994 Crash on count distinct over a columnar string in columnar storage
- Issue #995 MCL: min(pickup_datetime) from taxi1 crashes
- Issue #997 empty excludes JSON query removes columns from select list
- Issue #998 Secondary tasks run on current scheduler sometimes cause abnormal side effects
- Issue #999 crash with facet distinct and different schemas
- Issue #1000 MCL: Columnar rt index became damaged after run without columnar library
- Issue #1001 implicit cutoff is not working in json
- Issue #1002 Columnar grouper issue
- Issue #1003 Unable to delete last field from the index
- Issue #1004 wrong behaviour after --new-cluster
- Issue #1005 "columnar library not loaded", but it's not required
- Issue #1006 no error for delete query
- Issue #1010 Fixed ICU data file location in Windows builds
- PR #1018 Handshake send problem
- Issue #1020 Display id in show create table
- Issue #1024 crash 1 Crash / Segmentation Fault on Facet search with larger number of results.
- Commit 4739 Thread gets stuck on shutdown while replication is busy between nodes
- Commit ab87 Mixing floats and ints in a JSON range filter could make Manticore ignore the filter
- Commit d001 Float filters in JSON were inaccurate
- Commit 4092 Discard uncommitted txns if index altered (or it can crash)
- Commit 9692 Query syntax error when using backslash
- Commit 0c19 workers_clients could be wrong in SHOW STATUS
- Commit 1772 fixed a crash on merging ram segments w/o docstores
- Commit f45b Fixed missed ALL/ANY condition for equals JSON filter
- Commit 3e83 Replication could fail with
got exception while reading ist stream: mkstemp(./gmb_pF6TJi) failed: 13 (Permission denied)if the searchd was started from a directory it can't write to. - Commit 92e5 Since 4.0.2 crash log included only offsets. This commit fixes that.
Released: May 30th 2022
- ❗Issue #791 - wrong stack size could cause a crash.
Released: May 18th 2022
-
🔬 Support for Manticore Columnar Library 1.15.2, which enables Secondary indexes beta version. Building secondary indexes is on by default for plain and real-time columnar and row-wise indexes (if Manticore Columnar Library is in use), but to enable it for searching you need to set
secondary_indexes = 1either in your configuration file or using SET GLOBAL. The new functionality is supported in all operating systems except old Debian Stretch and Ubuntu Xenial. -
Read-only mode: you can now specify listeners that process only read queries discarding any writes.
-
New /cli endpoint for running SQL queries over HTTP even easier.
-
Faster bulk INSERT/REPLACE/DELETE via JSON over HTTP: previously you could provide multiple write commands via HTTP JSON protocol, but they were processed one by one, now they are handled as a single transaction.
-
#720 Nested filters support in JSON protocol. Previously you couldn't code things like
a=1 and (b=2 or c=3)in JSON:must(AND),should(OR) andmust_not(NOT) worked only on the highest level. Now they can be nested. -
Support for Chunked transfer encoding in HTTP protocol. You can now use chunked transfer in your application to transfer large batches with lower resource consumption (since you don't need to calculate
Content-Length). On the server's side Manticore now always processes incoming HTTP data in streaming fashion without waiting for the whole batch to be transferred as previously, which:- decreases peak RAM consumption, which lowers a chance of OOM
- decreases response time (our tests showed 11% decrease for processing a 100MB batch)
- lets you overcome max_packet_size and transfer batches much larger than the largest allowed value of
max_packet_size(128MB), e.g. 1GB at once.
-
#719 HTTP interface support of
100 Continue: now you can transfer large batches fromcurl(including curl libraries used by various programming languages) which by default doesExpect: 100-continueand waits some time before actually sending the batch. Previously you had to addExpect:header, now it's not needed.MORE -
⚠️ BREAKING CHANGE: Pseudo sharding is enabled by default. If you want to disable it make sure you add
pseudo_sharding = 0to sectionsearchdof your Manticore configuration file. -
Having at least one full-text field in a real-time/plain index is not mandatory anymore. You can now use Manticore even in cases not having anything to do with full-text search.
-
Fast fetching for attributes backed by Manticore Columnar Library: queries like
select * from <columnar table>are now much faster than previously, especially if there are many fields in the schema. -
⚠️ BREAKING CHANGE: Implicit cutoff. Manticore now doesn't spend time and resources processing data you don't need in the result set which will be returned. The downside is that it affects
total_foundin SHOW META and hits.total in JSON output. It is now only accurate in case you seetotal_relation: eqwhiletotal_relation: gtemeans the actual number of matching documents is greater than thetotal_foundvalue you've got. To retain the previous behaviour you can use search optioncutoff=0, which makestotal_relationalwayseq. -
⚠️ BREAKING CHANGE: All full-text fields are now stored by default. You need to use
stored_fields =(empty value) to make all fields non-stored (i.e. revert to the previous behaviour). -
#715 HTTP JSON supports search options.
- ⚠️ BREAKING CHANGE: Index meta file format change. Previously meta files (
.meta,.sph) were in binary format, now it's just json. The new Manticore version will convert older indexes automatically, but:- you can get warning like
WARNING: ... syntax error, unexpected TOK_IDENT - you won't be able to run the index with previous Manticore versions, make sure you have a backup
- you can get warning like
- ⚠️ BREAKING CHANGE: Session state support with help of HTTP keep-alive. This makes HTTP stateful when the client supports it too. For example, using the new /cli endpoint and HTTP keep-alive (which is on by default in all browsers) you can call
SHOW METAafterSELECTand it will work the same way it works via mysql. Note, previouslyConnection: keep-aliveHTTP header was supported too, but it only caused reusing the same connection. Since this version it also makes the session stateful. - You can now specify
columnar_attrs = *to define all your attributes as columnar in the plain mode which is useful in case the list is long. - Faster replication SST
- ⚠️ BREAKING CHANGE: Replication protocol has been changed. If you are running a replication cluster, then when upgrading to Manticore 5 you need to:
- stop all your nodes first cleanly
- and then start the node which was stopped last with
--new-cluster(run toolmanticore_new_clusterin Linux). - read about restarting a cluster for more details.
- Replication improvements:
- Faster SST
- Noise resistance which can help in case of unstable network between replication nodes
- Improved logging
- Security improvement: Manticore now listens on
127.0.0.1instead of0.0.0.0in case nolistenat all is specified in config. Even though in the default configuration which is shipped with Manticore Search thelistensetting is specified and it's not typical to have a configuration with nolistenat all, it's still possible. Previously Manticore would listen on0.0.0.0which is not secure, now it listens on127.0.0.1which is usually not exposed to the Internet. - Faster aggregation over columnar attributes.
- Increased
AVG()accuracy: previously Manticore usedfloatinternally for aggregations, now it usesdoublewhich increases the accuracy significantly. - Improved support for JDBC MySQL driver.
DEBUG malloc_statssupport for jemalloc.- optimize_cutoff is now available as a per-table setting which can be set when you CREATE or ALTER a table.
- ⚠️ BREAKING CHANGE: query_log_format is now
sphinxqlby default. If you are used toplainformat you need to addquery_log_format = plainto your configuration file. - Significant memory consumption improvements: Manticore consumes significantly less RAM now in case of long and intensive insert/replace/optimize workload in case stored fields are used.
- shutdown_timeout default value was increased from 3 seconds to 60 seconds.
- Commit ffd0 Support for Java mysql connector >= 6.0.3: in Java mysql connection 6.0.3 they changed the way they connect to mysql which broke compatibility with Manticore. The new behaviour is now supported.
- Commit 1da6 disabled saving a new disk chunk on loading an index (e.g. on searchd startup).
- Issue #746 Support for glibc >= 2.34.
- Issue #784 count 'VIP' connections separately from usual (non-VIP). Previously VIP connections were counted towards the
max_connectionslimit, which could cause "maxed out" error for non-VIP connections. Now VIP connections are not counted towards the limit. Current number of VIP connections can be also seen inSHOW STATUSandstatus. - ID can now be specified explicitly.
- Issue #687 support zstd compression for mysql proto
- ⚠️ BM25F formula has been slightly updated to improve search relevance. This only affects search results in case you use function BM25F(), it doesn't change behaviour of the default ranking formula.
- ⚠️ Changed behaviour of REST /sql endpoint:
/sql?mode=rawnow requires escaping and returns an array. - ⚠️ Format change of the response of
/bulkINSERT/REPLACE/DELETE requests:- previously each sub-query constituted a separate transaction and resulted in a separate response
- now the whole batch is considered a single transaction, which returns a single response
- ⚠️ Search options
low_priorityandboolean_simplifynow require a value (0/1): previously you could doSELECT ... OPTION low_priority, boolean_simplify, now you need to doSELECT ... OPTION low_priority=1, boolean_simplify=1. - ⚠️ If you are using old php, python or java clients please follow the corresponding link and find an updated version. The old versions are not fully compatible with Manticore 5.
- ⚠️ HTTP JSON requests are now logged in different format in mode
query_log_format=sphinxql. Previously only full-text part was logged, now it's logged as is.
-
⚠️ BREAKING CHANGE: because of the new structure when you upgrade to Manticore 5 it's recommended to remove old packages before you install the new ones:
- RPM-based:
yum remove manticore* - Debian and Ubuntu:
apt remove manticore*
- RPM-based:
-
New deb/rpm packages structure. Previous versions provided:
manticore-serverwithsearchd(main search daemon) and all needed for itmanticore-toolswithindexerandindextoolmanticoreincluding everythingmanticore-allRPM as a meta package referring tomanticore-serverandmanticore-tools
The new structure is:
manticore- deb/rpm meta package which installs all the above as dependenciesmanticore-server-core-searchdand everything to run it alonemanticore-server- systemd files and other supplementary scriptsmanticore-tools-indexer,indextooland other toolsmanticore-common- default configuration file, default data directory, default stopwordsmanticore-icudata,manticore-dev,manticore-converterdidn't change much.tgzbundle which includes all the packages
-
Support for Ubuntu Jammy
-
Support for Amazon Linux 2 via YUM repo
- Issue #815 Random crash when using UDF function
- Issue #287 out of memory while indexing RT index
- Issue #604 Breaking change 3.6.0, 4.2.0 sphinxql-parser
- Issue #667 FATAL: out of memory (unable to allocate 9007199254740992 bytes)
- Issue #676 Strings not passed correctly to UDFs
- ❗Issue #698 Searchd crashes after trying to add a text column to a rt index
- Issue #705 Indexer couldn't find all columns
- ❗Issue #709 Grouping by json.boolean works wrong
- Issue #716 indextool commands related to index (eg. --dumpdict) failure
- ❗Issue #724 Fields disappear from the selection
- Issue #727 .NET HttpClient Content-Type incompatibility when using
application/x-ndjson - Issue #729 Field length calculation
- ❗Issue #730 create/insert into/drop columnar table has a memleak
- Issue #731 Empty column in results under certain conditions
- ❗Issue #749 Crash of daemon on start
- ❗Issue #750 Daemon hangs on start
- ❗Issue #751 Crash at SST
- Issue #752 Json attribute marked as columnar when engine='columnar'
- Issue #753 Replication listens on 0
- Issue #754 columnar_attrs = * is not working with csvpipe
- ❗Issue #755 Crash on select float in columnar in rt
- ❗Issue #756 Indextool changes rt index during check
- Issue #757 Need a check for listeners port range intersections
- Issue #758 Log original error in case RT index failed to save disk chunk
- Issue #759 Only one error reported for RE2 config
- ❗Issue #760 RAM consumption changes in commit 5463778558586d2508697fa82e71d657ac36510f
- Issue #761 3rd node doesn't make a non-primary cluster after dirty restart
- Issue #762 Update counter gets increased by 2
- Issue #763 New version 4.2.1 corrupt index created with 4.2.0 with morphology using
- Issue #764 No escaping in json keys /sql?mode=raw
- ❗Issue #765 Using function hides other values
- ❗Issue #766 Memleak triggered by a line in FixupAttrForNetwork
- ❗Issue #767 Memleak in 4.2.0 and 4.2.1 related with docstore cache
- Issue #768 Strange ping-pong with stored fields over network
- Issue #769 lemmatizer_base reset to empty if not mentioned in 'common' section
- Issue #770 pseudo_sharding makes SELECT by id slower
- Issue #771 DEBUG malloc_stats output zeros when using jemalloc
- Issue #772 Drop/add column makes value invisible
- Issue #773 Can't add column bit(N) to columnar table
- Issue #774 "cluster" gets empty on start in manticore.json
- ❗Commit 1da4 HTTP actions are not tracked in SHOW STATUS
- Commit 3810 disable pseudo_sharding for low frequency single keyword queries
- Commit 8003 fixed stored attributes vs index merge
- Commit cddf generalized distinct value fetchers; added specialized distinct fetchers for columnar strings
- Commit fba4 fixed fetching null integer attributes from docstore
- Commit f300
rankercould be specified twice in query log
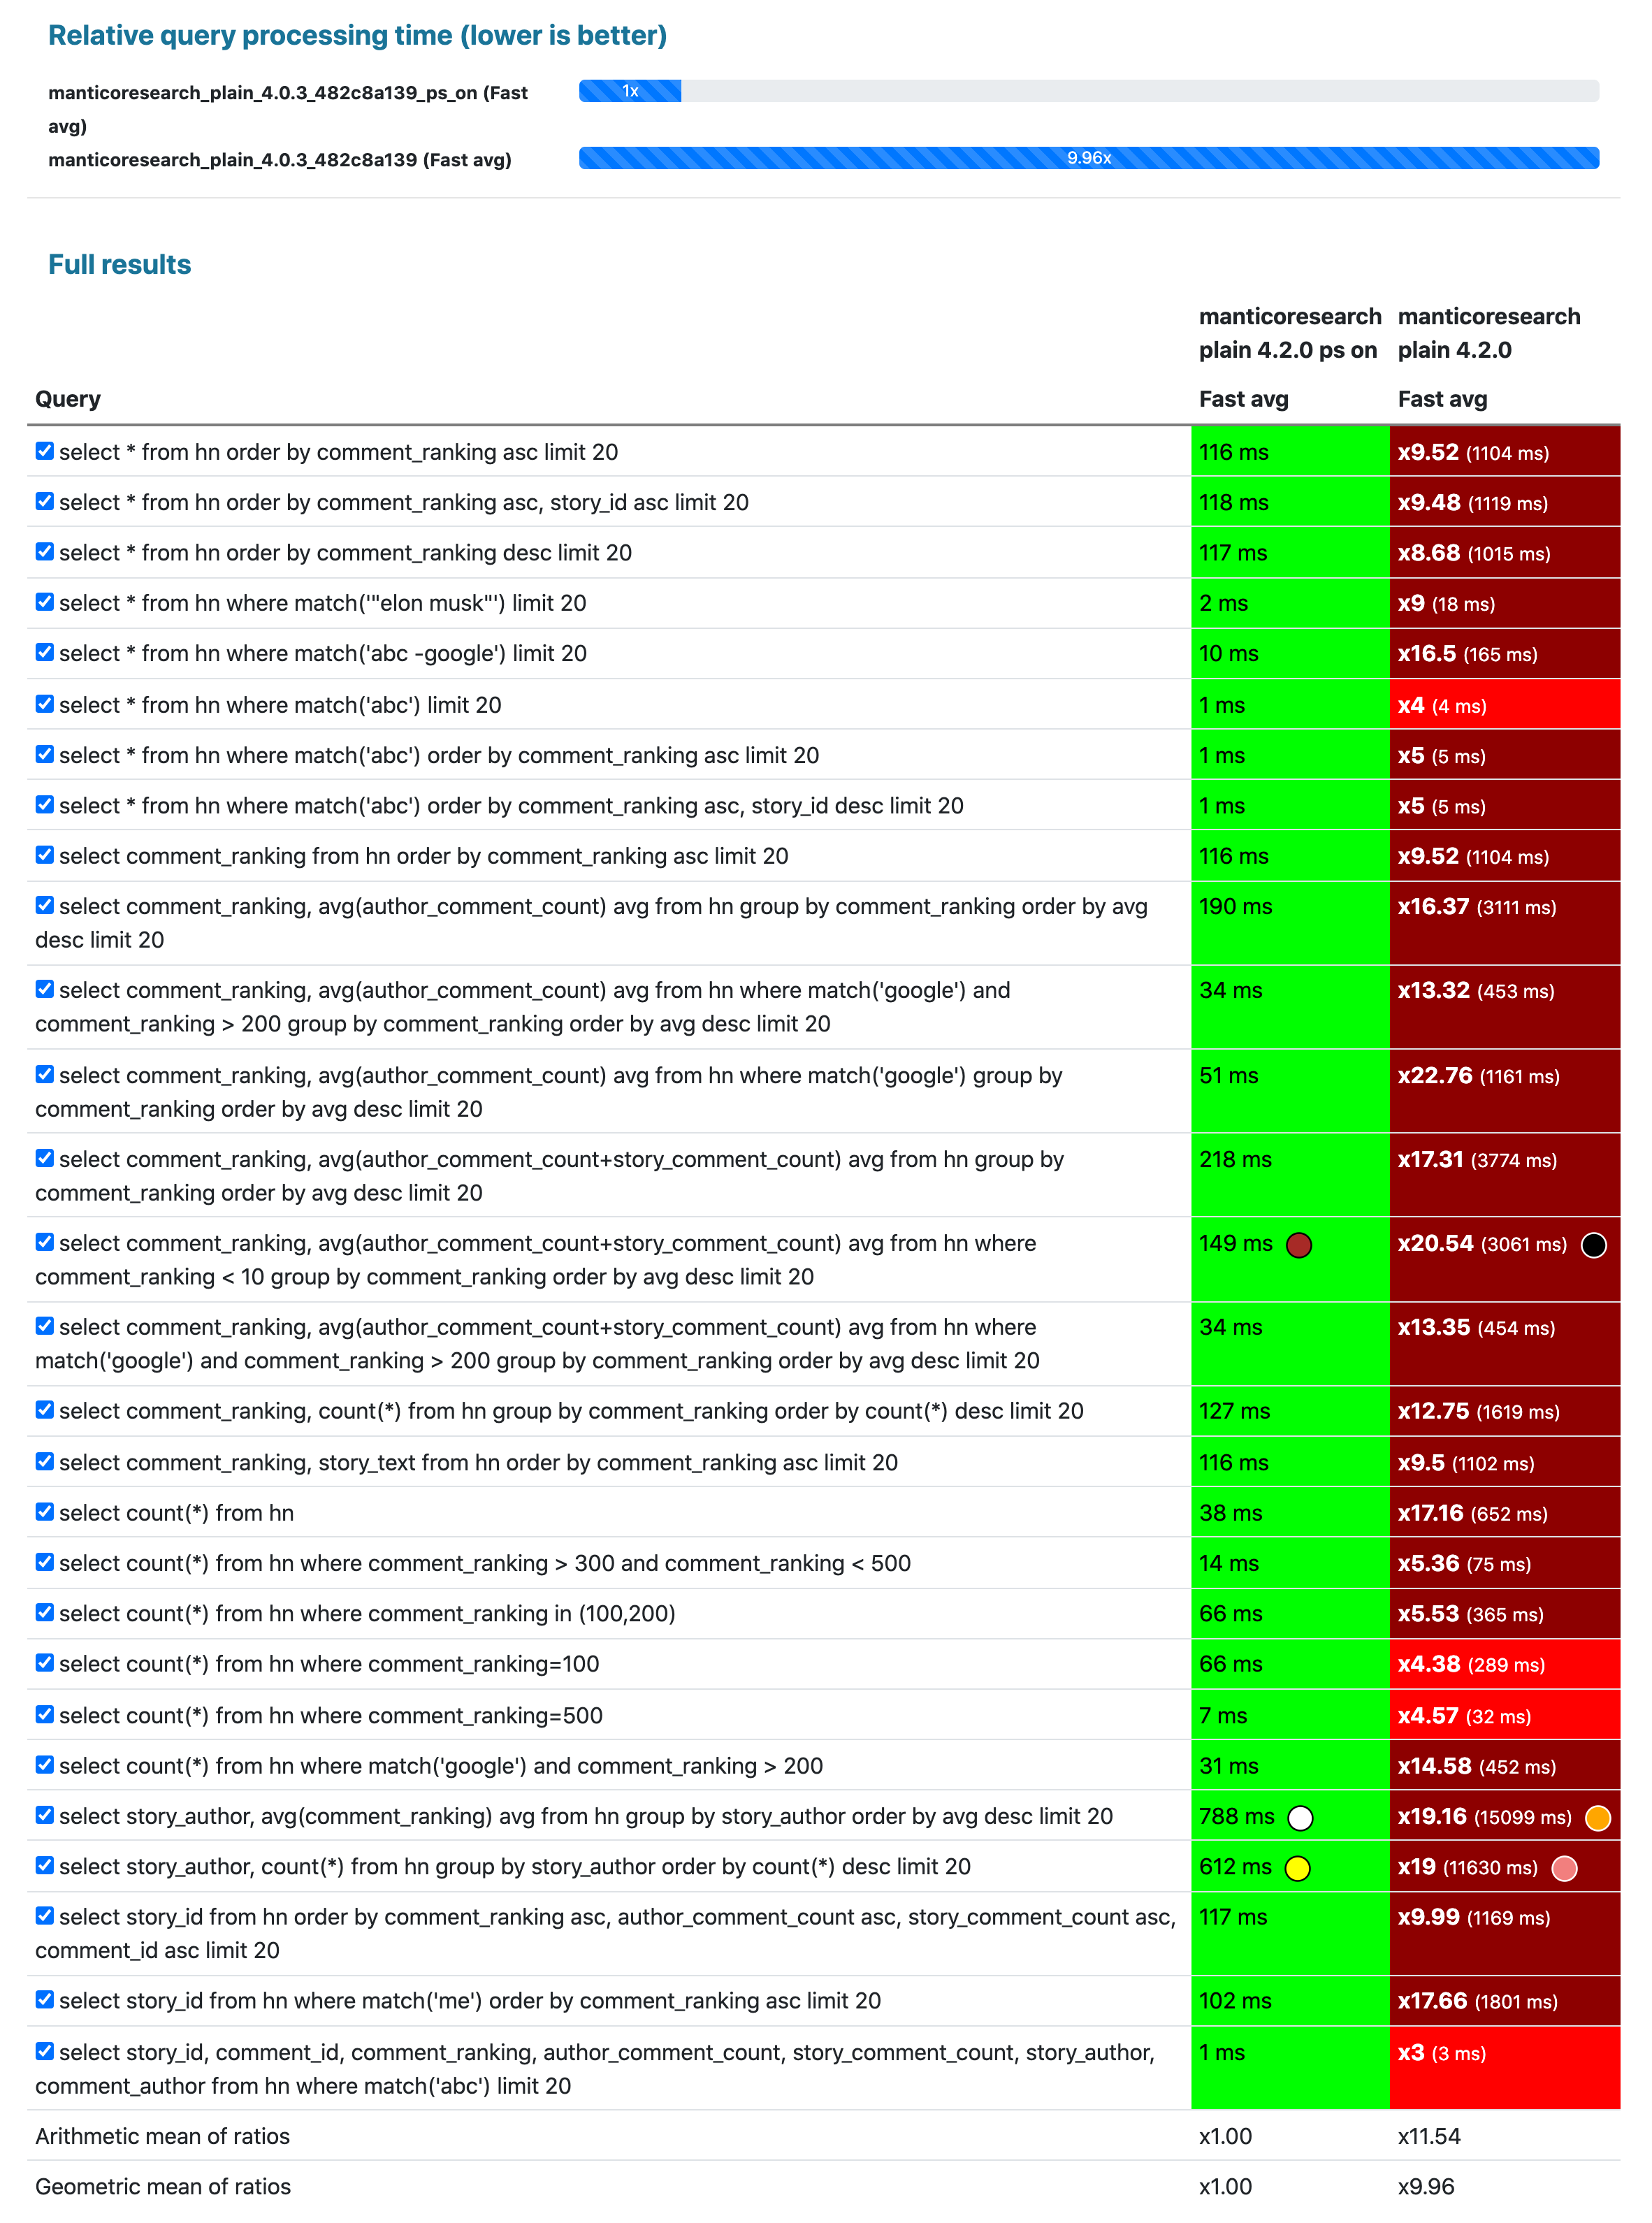
- Pseudo-sharding support for real-time indexes and full-text queries. In previous release we added limited pseudo sharding support. Starting from this version you can get all benefits of the pseudo sharding and your multi-core processor by just enabling searchd.pseudo_sharding. The coolest thing is that you don't need to do anything with your indexes or queries for that, just enable it and if you have free CPU it will be used to lower your response time. It supports plain and real-time indexes for full-text, filtering and analytical queries. For example, here is how enabling pseudo sharding can make most queries' response time in average about 10x lower on Hacker news curated comments dataset multiplied 100 times (116 million docs in a plain index).
- Debian Bullseye is now supported.
- PQ transactions are now atomic and isolated. Previously PQ transactions support was limited. It enables much faster REPLACE into PQ, especially when you need to replace a lot of rules at once. Performance details:
- 4.0.2
- 4.2.0
It takes 48 seconds to insert 1M PQ rules and 406 seconds to REPLACE just 40K in 10K batches.
root@perf3 ~ # mysql -P9306 -h0 -e "drop table if exists pq; create table pq (f text, f2 text, j json, s string) type='percolate';"; date; for m in `seq 1 1000`; do (echo -n "insert into pq (id,query,filters,tags) values "; for n in `seq 1 1000`; do echo -n "(0,'@f (cat | ( angry dog ) | (cute mouse)) @f2 def', 'j.json.language=\"en\"', '{\"tag1\":\"tag1\",\"tag2\":\"tag2\"}')"; [ $n != 1000 ] && echo -n ","; done; echo ";")|mysql -P9306 -h0; done; date; mysql -P9306 -h0 -e "select count(*) from pq"

Wed Dec 22 10:24:30 AM CET 2021
Wed Dec 22 10:25:18 AM CET 2021
+----------+
| count(*) |
+----------+
|  1000000 |
+----------+

root@perf3 ~ # date; (echo "begin;"; for offset in `seq 0 10000 30000`; do n=0; echo "replace into pq (id,query,filters,tags) values "; for id in `mysql -P9306 -h0 -NB -e "select id from pq limit $offset, 10000 option max_matches=1000000"`; do echo "($id,'@f (tiger | ( angry bear ) | (cute panda)) @f2 def', 'j.json.language=\"de\"', '{\"tag1\":\"tag1\",\"tag2\":\"tag2\"}')"; n=$((n+1)); [ $n != 10000 ] && echo -n ","; done; echo ";"; done; echo "commit;") > /tmp/replace.sql; date
Wed Dec 22 10:26:23 AM CET 2021
Wed Dec 22 10:26:27 AM CET 2021
root@perf3 ~ # time mysql -P9306 -h0 < /tmp/replace.sql

real    6m46.195s
user    0m0.035s
sys 0m0.008s
It takes 34 seconds to insert 1M PQ rules and 23 seconds to REPLACE them in 10K batches.
root@perf3 ~ # mysql -P9306 -h0 -e "drop table if exists pq; create table pq (f text, f2 text, j json, s string) type='percolate';"; date; for m in `seq 1 1000`; do (echo -n "insert into pq (id,query,filters,tags) values "; for n in `seq 1 1000`; do echo -n "(0,'@f (cat | ( angry dog ) | (cute mouse)) @f2 def', 'j.json.language=\"en\"', '{\"tag1\":\"tag1\",\"tag2\":\"tag2\"}')"; [ $n != 1000 ] && echo -n ","; done; echo ";")|mysql -P9306 -h0; done; date; mysql -P9306 -h0 -e "select count(*) from pq"

Wed Dec 22 10:06:38 AM CET 2021
Wed Dec 22 10:07:12 AM CET 2021
+----------+
| count(*) |
+----------+
|  1000000 |
+----------+

root@perf3 ~ # date; (echo "begin;"; for offset in `seq 0 10000 990000`; do n=0; echo "replace into pq (id,query,filters,tags) values "; for id in `mysql -P9306 -h0 -NB -e "select id from pq limit $offset, 10000 option max_matches=1000000"`; do echo "($id,'@f (tiger | ( angry bear ) | (cute panda)) @f2 def', 'j.json.language=\"de\"', '{\"tag1\":\"tag1\",\"tag2\":\"tag2\"}')"; n=$((n+1)); [ $n != 10000 ] && echo -n ","; done; echo ";"; done; echo "commit;") > /tmp/replace.sql; date
Wed Dec 22 10:12:31 AM CET 2021
Wed Dec 22 10:14:00 AM CET 2021
root@perf3 ~ # time mysql -P9306 -h0 < /tmp/replace.sql

real    0m23.248s
user    0m0.891s
sys 0m0.047s- optimize_cutoff is now available as a configuration option in section
searchd. It's useful when you want to limit the RT chunks count in all your indexes to a particular number globally. - Commit 0087 accurate count(distinct ...) and FACET ... distinct over several local physical indexes (real-time/plain) with identical fields set/order.
- PR #598 bigint support for
YEAR()and other timestamp functions. - Commit 8e85 Adaptive rt_mem_limit. Previously Manticore Search was collecting exactly up to
rt_mem_limitof data before saving a new disk chunk to disk, and while saving was still collecting up to 10% more (aka double-buffer) to minimize possible insert suspension. If that limit was also exhausted, adding new documents was blocked until the disk chunk was fully saved to disk. The new adaptive limit is built on the fact that we have auto-optimize now, so it's not a big deal if disk chunks do not fully respectrt_mem_limitand start flushing a disk chunk earlier. So, now we collect up to 50% ofrt_mem_limitand save that as a disk chunk. Upon saving we look at the statistics (how much we've saved, how many new documents have arrived while saving) and recalculate the initial rate which will be used next time. For example, if we saved 90 million documents, and another 10 million docs arrived while saving, the rate is 90%, so we know that next time we can collect up to 90% ofrt_mem_limitbefore starting flushing another disk chunk. The rate value is calculated automatically from 33.3% to 95%. - Issue #628 unpack_zlib for PostgreSQL source. Thank you, Dmitry Voronin for the contribution.
- Commit 6d54
indexer -vand--version. Previously you could still see indexer's version, but-v/--versionwere not supported. - Issue #662 infinit mlock limit by default when Manticore is started via systemd.
- Commit 63c8 spinlock -> op queue for coro rwlock.
- Commit 4113 environment variable
MANTICORE_TRACK_RT_ERRORSuseful for debugging RT segments corruption.
- Binlog version was increased, binlog from previous version won't be replayed, so make sure you stop Manticore Search cleanly during upgrade: no binlog files should be in
/var/lib/manticore/binlog/exceptbinlog.metaafter stopping the previous instance. - Commit 3f65 new column "chain" in
show threads option format=all. It shows stack of some task info tickets, most useful for profiling needs, so if you are parsingshow threadsoutput be aware of the new column. searchd.workerswas obsoleted since 3.5.0, now it's deprecated, if you still have it in your configuration file it will trigger a warning on start. Manticore Search will start, but with a warning.- If you use PHP and PDO to access Manticore you need to do
PDO::ATTR_EMULATE_PREPARES
- ❗Issue #650 Manticore 4.0.2 slower than Manticore 3.6.3. 4.0.2 was faster than previous versions in terms of bulk inserts, but significantly slower for single document inserts. It's been fixed in 4.2.0.
- ❗Commit 22f4 RT index could get corrupted under intensive REPLACE load, or it could crash
- Commit 03be fixed average at merging groupers and group N sorter; fixed merge of aggregates
- Commit 2ea5
indextool --checkcould crash - Commit 7ec7 RAM exhaustion issue caused by UPDATEs
- Commit 658a daemon could hang on INSERT
- Commit 46e4 daemon could hang on shutdown
- Commit f8d7 daemon could crash on shutdown
- Commit 733a daemon could hang on crash
- Commit f7f8 daemon could crash on startup trying to rejoin cluster with invalid nodes list
- Commit 1401 distributed index could get completely forgotten in RT mode in case it couldn't resolve one of its agents on start
- Issue #683 attr bit(N) engine='columnar' fails
- Issue #682 create table fails, but leaves dir
- Issue #663 Config fails with: unknown key name 'attr_update_reserve'
- Issue #632 Manticore crash on batch queries
- Issue #679 Batch queries causing crashes again with v4.0.3
- Commit f7f8 fixed daemon crash on startup trying to re-join cluster with invalid nodes list
- Issue #643 Manticore 4.0.2 does not accept connections after batch of inserts
- Issue #635 FACET query with ORDER BY JSON.field or string attribute could crash
- Issue #634 Crash SIGSEGV on query with packedfactors
- Commit 4165 morphology_skip_fields was not supported by create table
-
Full support of Manticore Columnar Library. Previously Manticore Columnar Library was supported only for plain indexes. Now it's supported:
- in real-time indexes for
INSERT,REPLACE,DELETE,OPTIMIZE - in replication
- in
ALTER - in
indextool --check
- in real-time indexes for
-
Automatic indexes compaction (Issue #478). Finally, you don't have to call OPTIMIZE manually or via a crontask or other kind of automation. Manticore now does it for you automatically and by default. You can set default compaction threshold via optimize_cutoff global variable.
-
Chunk snapshots and locks system revamp. These changes may be invisible from outside at first glance, but they improve the behaviour of many things happening in real-time indexes significantly. In a nutshell, previously most Manticore data manipulation operations relied on locks heavily, now we use disk chunk snapshots instead.
-
Significantly faster bulk INSERT performance into a real-time index. For example on Hetzner's server AX101 with SSD, 128 GB of RAM and AMD's Ryzen™ 9 5950X (16*2 cores) with 3.6.0 you could get 236K docs per second inserted into a table with schema
name text, email string, description text, age int, active bit(1)(defaultrt_mem_limit, batch size 25000, 16 concurrent insert workers, 16 million docs inserted overall). In 4.0.2 the same concurrency/batch/count gives 357K docs per second.MORE -
ALTER can add/remove a full-text field (in RT mode). Previously it could only add/remove an attribute.
-
🔬 Experimental: pseudo-sharding for full-scan queries - allows to parallelize any non-full-text search query. Instead of preparing shards manually you can now just enable new option searchd.pseudo_sharding and expect up to
CPU coreslower response time for non-full-text search queries. Note it can easily occupy all existing CPU cores, so if you care not only about latency, but throughput too - use it with caution.
- Linux Mint and Ubuntu Hirsute Hippo are supported via APT repository
- faster update by id via HTTP in big indexes in some cases (depends on the ids distribution)
- 671e65a2 - added caching to lemmatizer-uk
- 3.6.0
- 4.0.2
time curl -X POST -d '{"update":{"index":"idx","id":4611686018427387905,"doc":{"mode":0}}}' -H "Content-Type: application/x-ndjson" http://127.0.0.1:6358/json/bulk
real    0m43.783s
user    0m0.008s
sys     0m0.007s
time curl -X POST -d '{"update":{"index":"idx","id":4611686018427387905,"doc":{"mode":0}}}' -H "Content-Type: application/x-ndjson" http://127.0.0.1:6358/json/bulk
real 0m0.006s
user 0m0.004s
sys 0m0.001s- custom startup flags for systemd. Now you don't need to start searchd manually in case you need to run Manticore with some specific startup flag
- new function LEVENSHTEIN() which calculates Levenshtein distance
- added new searchd startup flags
--replay-flags=ignore-trx-errorsand--replay-flags=ignore-all-errorsso one can still start searchd if the binlog is corrupted - Issue #621 - expose errors from RE2
- more accurate COUNT(DISTINCT) for distributed indexes consisting of local plain indexes
- FACET DISTINCT to remove duplicates when you do faceted search
- exact form modifier doesn't require morphology now and works for indexes with infix/prefix search enabled
- the new version can read older indexes, but the older versions can't read Manticore 4's indexes
- removed implicit sorting by id. Sort explicitly if required
charset_table's default value changes from0..9, A..Z->a..z, _, a..z, U+410..U+42F->U+430..U+44F, U+430..U+44F, U+401->U+451, U+451tonon_cjkOPTIMIZEhappens automatically. If you don't need it make sure to setauto_optimize=0in sectionsearchdin the configuration file- Issue #616
ondisk_attrs_defaultwere deprecated, now they are removed - for contributors: we now use Clang compiler for Linux builds as according to our tests it can build a faster Manticore Search and Manticore Columnar Library
- if max_matches is not specified in a search query it gets updated implicitly with the lowest needed value for the sake of performance of the new columnar storage. It can affect metric
totalin SHOW META, but nottotal_foundwhich is the actual number of found documents.
- make sure you a stop Manticore 3 cleanly:
- no binlog files should be in
/var/lib/manticore/binlog/(onlybinlog.metashould be in the directory) - otherwise the indexes Manticore 4 can't reply binlogs for won't be run
- no binlog files should be in
- the new version can read older indexes, but the older versions can't read Manticore 4's indexes, so make sure you make a backup if you want to be able to rollback the new version easily
- if you run a replication cluster make sure you:
- stop all your nodes first cleanly
- and then start the node which was stopped last with
--new-cluster(run toolmanticore_new_clusterin Linux). - read about restarting a cluster for more details
- Lots of replication issues have been fixed:
- Commit 696f - fixed crash during SST on joiner with active index; added sha1 verify at joiner node at writing file chunks to speed up index loading; added rotation of changed index files at joiner node on index load; added removal of index files at joiner node when active index gets replaced by a new index from donor node; added replication log points at donor node for sending files and chunks
- Commit b296 - crash on JOIN CLUSTER in case the address is incorrect
- Commit 418b - while initial replication of a large index the joining node could fail with
ERROR 1064 (42000): invalid GTID, (null), the donor could become unresponsive while another node was joining - Commit 6fd3 - hash could be calculated wrong for a big index which could result in replication failure
- Issue #615 - replication failed on cluster restart
- Issue #574 -
indextool --helpdoesn't display parameter--rotate - Issue #578 - searchd high CPU usage while idle after ca. a day
- Issue #587 - flush .meta immediately
- Issue #617 - manticore.json gets emptied
- Issue #618 - searchd --stopwait fails under root. It also fixes systemctl behaviour (previously it was showing failure for ExecStop and didn't wait long enough for searchd to stop properly)
- Issue #619 - INSERT/REPLACE/DELETE vs SHOW STATUS.
command_insert,command_replaceand others were showing wrong metrics - Issue #620 -
charset_tablefor a plain index had a wrong default value - Commit 8f75 - new disk chunks don't get mlocked
- Issue #607 - Manticore cluster node crashes when unable to resolve a node by name
- Issue #623 - replication of updated index can lead to undefined state
- Commit ca03 - indexer could hang on indexing a plain index source with a json attribute
- Commit 53c7 - fixed not equal expression filter at PQ index
- Commit ccf9 - fixed select windows at list queries above 1000 matches.
SELECT * FROM pq ORDER BY id desc LIMIT 1000 , 100 OPTION max_matches=1100was not working previously - Commit a048 - HTTPS request to Manticore could cause warning like "max packet size(8388608) exceeded"
- Issue #648 - Manticore 3 could hang after a few updates of string attributes
Maintenance release before Manticore 4
- Support for Manticore Columnar Library for plain indexes. New setting columnar_attrs for plain indexes
- Support for Ukrainian Lemmatizer
- Fully revised histograms. When building an index Manticore also builds histograms for each field in it, which it then uses for faster filtering. In 3.6.0 the algorithm was fully revised and you can get a higher performance if you have a lot of data and do a lot of filtering.
- tool
manticore_new_cluster [--force]useful for restarting a replication cluster via systemd - --drop-src for
indexer --merge - new mode
blend_mode='trim_all' - added support for escaping JSON path with backticks
- indextool --check can work in RT mode
- FORCE/IGNORE INDEX(id) for SELECT/UPDATE
- chunk id for a merged disk chunk is now unique
- indextool --check-disk-chunk CHUNK_NAME
- faster JSON parsing, our tests show 3-4% lower latency on queries like
WHERE json.a = 1 - non-documented command
DEBUG SPLITas a prerequisite for automatic sharding/rebalancing
- Issue #584 - inaccurate and unstable FACET results
- Issue #506 - Strange behavior when using MATCH: those who suffer from this issue need to rebuild the index as the problem was on the phase of building an index
- Issue #387 - intermittent core dump when running query with SNIPPET() function
- Stack optimizations useful for processing complex queries:
- Issue #469 - SELECT results in CRASH DUMP
- e8420cc7 - stack size detection for filter trees
- Issue #461 - Update using the IN condition does not take effect correctly
- Issue #464 - SHOW STATUS immediately after CALL PQ returns - Issue #481 - Fixed static binary build
- Issue #502 - bug in multi-queries
- Issue #514 - Unable to use unusual names for columns when use 'create table'
- Commit d1db - daemon crash on replay binlog with update of string attribute; set binlog version to 10
- Commit 775d - fixed expression stack frame detection runtime (test 207)
- Commit 4795 - percolate index filter and tags were empty for empty stored query (test 369)
- Commit c3f0 - breaks of replication SST flow at network with long latency and high error rate (different data centers replication); updated replication command version to 1.03
- Commit ba2d - joiner lock cluster on write operations after join into cluster (test 385)
- Commit de4d - wildcards matching with exact modifier (test 321)
- Commit 6524 - docid checkpoints vs docstore
- Commit f4ab - Inconsistent indexer behavior when parsing invalid xml
- Commit 7b72 - Stored percolate query with NOTNEAR runs forever (test 349)
- Commit 812d - wrong weight for phrase starting with wildcard
- Commit 1771 - percolate query with wildcards generate terms without payload on matching causes interleaved hits and breaks matching (test 417)
- Commit aa0d - fixed calculation of 'total' in case of parallelized query
- Commit 18d8 - crash in Windows with multiple concurrent sessions at daemon
- Commit 8443 - some index settings could not be replicated
- Commit 9341 - On high rate of adding new events netloop sometimes freeze because of atomic 'kick' event being processed once for several events a time and loosing actual actions from them status of the query, not the server status
- Commit d805 - New flushed disk chunk might be lost on commit
- Commit 63cb - inaccurate 'net_read' in profiler
- Commit f537 - Percolate issue with arabic (right to left texts)
- Commit 49ee - id not picked correctly on duplicate column name
- Commit refa of network events to fix a crash in rare cases
- e8420cc7 fix in
indextool --dumpheader - Commit ff71 - TRUNCATE WITH RECONFIGURE worked wrong with stored fields
- New binlog format: you need to make a clean stop of Manticore before upgrading
- Index format slightly changes: the new version can read you existing indexes fine, but if you decide to downgrade from 3.6.0 to an older version the newer indexes will be unreadable
- Replication format change: don't replicate from an older version to 3.6.0 and vice versa, switch to the new version on all your nodes at once
reverse_scanis deprecated. Make sure you don't use this option in your queries since 3.6.0 since they will fail otherwise- As of this release we don't provide builds for RHEL6, Debian Jessie and Ubuntu Trusty any more. If it's mission critical for you to have them supported contact us
- No more implicit sorting by id. If you rely on it make sure to update your queries accordingly
- Search option
reverse_scanhas been deprecated
- New Python, Javascript and Java clients are generally available now and are well documented in this manual.
- automatic drop of a disk chunk of a real-time index. This optimization enables dropping a disk chunk automatically when OPTIMIZing a real-time index when the chunk is obviously not needed any more (all the documents are suppressed). Previously it still required merging, now the chunk can be just dropped instantly. The cutoff option is ignored, i.e. even if nothing is actually merged an obsoleted disk chunk gets removed. This is useful in case you maintain retention in your index and delete older documents. Now compacting such indexes will be faster.
- standalone NOT as an option for SELECT
- Issue #453 New option indexer.ignore_non_plain=1 is useful in case you run
indexer --alland have not only plain indexes in the configuration file. Withoutignore_non_plain=1you'll get a warning and a respective exit code. - SHOW PLAN ... OPTION format=dot and EXPLAIN QUERY ... OPTION format=dot enable visualization of full-text query plan execution. Useful for understanding complex queries.
indexer --verboseis deprecated as it never added anything to the indexer output- For dumping watchdog's backtrace signal
USR2is now to be used instead ofUSR1
- Issue #423 cyrillic char period call snippets retain mode don't highlight
- Issue #435 RTINDEX - GROUP N BY expression select = fatal crash
- Commit 2b3b searchd status shows Segmentation fault when in cluster
- Commit 9dd2 'SHOW INDEX index.N SETTINGS' doesn't address chunks >9
- Issue #389 Bug that crashes Manticore
- Commit fba1 Converter creates broken indexes
- Commit eecd stopword_step=0 vs CALL SNIPPETS()
- Commit ea68 count distinct returns 0 at low max_matches on a local index
- Commit 362f When using aggregation stored texts are not returned in hits
- OPTIMIZE reduces disk chunks to a number of chunks ( default is
2* No. of cores) instead of a single one. The optimal number of chunks can be controlled by cutoff option. - NOT operator can be now used standalone. By default it is disabled since accidental single NOT queries can be slow. It can be enabled by setting new searchd directive not_terms_only_allowed to
0. - New setting max_threads_per_query sets how many threads a query can use. If the directive is not set, a query can use threads up to the value of threads.
Per
SELECTquery the number of threads can be limited with OPTION threads=N overriding the globalmax_threads_per_query. - Percolate indexes can be now be imported with IMPORT TABLE.
- HTTP API
/searchreceives basic support for faceting/grouping by new query nodeaggs.
- If no replication listen directive is declared, the engine will try to use ports after the defined 'sphinx' port, up to 200.
listen=...:sphinxneeds to be explicit set for SphinxSE connections or SphinxAPI clients.- SHOW INDEX STATUS outputs new metrics:
killed_documents,killed_rate,disk_mapped_doclists,disk_mapped_cached_doclists,disk_mapped_hitlistsanddisk_mapped_cached_hitlists. - SQL command
statusnow outputsQueue\ThreadsandTasks\Threads.
dist_threadsis completely deprecated now, searchd will log a warning if the directive is still used.
The official Docker image is now based on Ubuntu 20.04 LTS
Besides the usual manticore package, you can also install Manticore Search by components:
manticore-server-core- providessearchd, manpage, log dir, API and galera module. It will also installmanticore-commonas the dependency.manticore-server- provides automation scripts for core (init.d, systemd), andmanticore_new_clusterwrapper. It will also installmanticore-server-coreas the dependency.manticore-common- provides config, stopwords, generic docs and skeleton folders (datadir, modules, etc.)manticore-tools- provides auxiliary tools (indexer,indextooletc.), their manpages and examples. It will also installmanticore-commonas the dependency.manticore-icudata(RPM) ormanticore-icudata-65l(DEB) - provides ICU data file for icu morphology usage.manticore-devel(RPM) ormanticore-dev(DEB) - provides dev headers for UDFs.
- Commit 2a47 Crash of daemon at grouper at RT index with different chunks
- Commit 57a1 Fastpath for empty remote docs
- Commit 07dd Expression stack frame detection runtime
- Commit 08ae Matching above 32 fields at percolate indexes
- Commit 16b9 Replication listen ports range
- Commit 5fa6 Show create table on pq
- Commit 54d1 HTTPS port behavior
- Commit fdbb Mixing docstore rows when replacing
- Commit afb5 Switch TFO unavailable message level to 'info'
- Commit 59d9 Crash on strcmp invalid use
- Commit 04af Adding index to cluster with system (stopwords) files
- Commit 5014 Merge indexes with large dictionaries; RT optimize of large disk chunks
- Commit a2ad Indextool can dump meta from current version
- Commit 69f6 Issue in group order in GROUP N
- Commit 24d5 Explicit flush for SphinxSE after handshake
- Commit 31c4 Avoid copy of huge descriptions when not necessary
- Commit 2959 Negative time in show threads
- Commit f0b3 Token filter plugin vs zero position deltas
- Commit a49e Change 'FAIL' to 'WARNING' on multiple hits
-
This release took so long, because we were working hard on changing multitasking mode from threads to coroutines. It makes configuration simpler and queries parallelization much more straightforward: Manticore just uses given number of threads (see new setting threads) and the new mode makes sure it's done in the most optimal way.
-
Changes in highlighting:
- any highlighting that works with several fields (
highlight({},'field1, field2') orhighlightin json queries) now applies limits per-field by default. - any highlighting that works with plain text (
highlight({}, string_attr)orsnippet()now applies limits to the whole document. - per-field limits can be switched to global limits by
limits_per_field=0option (1by default). - allow_empty is now
0by default for highlighting via HTTP JSON.
- any highlighting that works with several fields (
-
The same port can now be used for http, https and binary API (to accept connections from a remote Manticore instance).
listen = *:mysqlis still required for connections via mysql protocol. Manticore now detects automatically the type of client trying to connect to it except for MySQL (due to restrictions of the protocol). -
In RT mode a field can now be text and string attribute at the same time - GitHub issue #331.
In plain mode it's called
sql_field_string. Now it's available in RT mode for real-time indexes too. You can use it as shown in the example:create table t(f string attribute indexed); insert into t values(0,'abc','abc'); select * from t where match('abc'); +---------------------+------+ | id | f | +---------------------+------+ | 2810845392541843463 | abc | +---------------------+------+ 1 row in set (0.01 sec) mysql> select * from t where f='abc'; +---------------------+------+ | id | f | +---------------------+------+ | 2810845392541843463 | abc | +---------------------+------+ 1 row in set (0.00 sec)
- You can now highlight string attributes.
- SSL and compression support for SQL interface
- Support of mysql client
statuscommand. - Replication can now replicate external files (stopwords, exceptions etc.).
- Filter operator
inis now available via HTTP JSON interface. expressionsin HTTP JSON.- You can now change
rt_mem_limiton the fly in RT mode, i.e. can doALTER ... rt_mem_limit=<new value>. - You can now use separate CJK charset tables:
chinese,japaneseandkorean. - thread_stack now limits maximum thread stack, not initial.
- Improved
SHOW THREADSoutput. - Display progress of long
CALL PQinSHOW THREADS. - cpustat, iostat, coredump can be changed during runtime with SET.
SET [GLOBAL] wait_timeout=NUMimplemented ,
- Index format has been changed. Indexes built in 3.5.0 cannot be loaded by Manticore version < 3.5.0, but Manticore 3.5.0 understands older formats.
INSERT INTO PQ VALUES()(i.e. without providing column list) previously expected exactly(query, tags)as the values. It's been changed to(id,query,tags,filters). The id can be set to 0 if you want it to be auto-generated.allow_empty=0is a new default in highlighting via HTTP JSON interface.- Only absolute paths are allowed for external files (stopwords, exceptions etc.) in
CREATE TABLE/ALTER TABLE.
ram_chunks_countwas renamed toram_chunk_segments_countinSHOW INDEX STATUS.workersis obsolete. There's only one workers mode now.dist_threadsis obsolete. All queries are as much parallel as possible now (limited bythreadsandjobs_queue_size).max_childrenis obsolete. Use threads to set the number of threads Manticore will use (set to the # of CPU cores by default).queue_max_lengthis obsolete. Instead of that in case it's really needed use jobs_queue_size to fine-tune internal jobs queue size (unlimited by default).- All
/json/*endpoints are now available w/o/json/, e.g./search,/insert,/delete,/pqetc. fieldmeaning "full-text field" was renamed to "text" indescribe.3.4.2:
mysql> describe t; +-------+--------+----------------+ | Field | Type | Properties | +-------+--------+----------------+ | id | bigint | | | f | field | indexed stored | +-------+--------+----------------+3.5.0:
mysql> describe t; +-------+--------+----------------+ | Field | Type | Properties | +-------+--------+----------------+ | id | bigint | | | f | text | indexed stored | +-------+--------+----------------+- Cyrillic
иdoesn't map toiinnon_cjkcharset_table (which is a default) as it affected Russian stemmers and lemmatizers too much. read_timeout. Use network_timeout instead which controls both reading and writing.
- Ubuntu Focal 20.04 official package
- deb package name changed from
manticore-bintomanticore
- Issue #351 searchd memory leak
- Commit ceab Tiny read out of bounds in snippets
- Commit 1c3e Dangerous write into local variable for crash queries
- Commit 26e0 Tiny memory leak of sorter in test 226
- Commit d2c7 Huge memory leak in test 226
- Commit 0dd8 Cluster shows the nodes are in sync, but
count(*)shows different numbers - Commit f1c1 Cosmetic: Duplicate and sometimes lost warning messages in the log
- Commit f1c1 Cosmetic: (null) index name in log
- Commit 359d Cannot retrieve more than 70M results
- Commit 19f3 Can't insert PQ rules with no-columns syntax
- Commit bf68 Misleading error message when inserting a document to an index in a cluster
- Commit 2cf1
/json/replaceandjson/updatereturn id in exponent form - Issue #324 Update json scalar properties and mva in the same query
- Commit d384
hitless_wordsdoesn't work in RT mode - Commit 5813
ALTER RECONFIGUREin rt mode should be disallowed - Commit 5813
rt_mem_limitgets reset to 128M after searchd restart - highlight() sometimes hangs
- Commit 7cd8 Failed to use U+code in RT mode
- Commit 2b21 Failed to use wildcard at wordforms at RT mode
- Commit e9d0 Fixed
SHOW CREATE TABLEvs multiple wordform files - Commit fc90 JSON query without "query" crashes searchd
- Manticore official docker couldn't index from mysql 8
- Commit 23e0 HTTP /json/insert requires id
- Commit bd67
SHOW CREATE TABLEdoesn't work for PQ - Commit bd67
CREATE TABLE LIKEdoesn't work properly for PQ - Commit 5eac End of line in settings in show index status
- Commit cb15 Empty title in "highlight" in HTTP JSON response
- Issue #318
CREATE TABLE LIKEinfix error - Commit 9040 RT crashes under load
- cd512c7d Lost crash log on crash at RT disk chunk
- Issue #323 Import table fails and closes the connection
- Commit 6275
ALTER reconfigurecorrupts a PQ index - Commit 9c1d Searchd reload issues after change index type
- Commit 71e2 Daemon crashes on import table with missed files
- Issue #322 Crash on select using multiple indexes, group by and ranker = none
- Commit c3f5
HIGHLIGHT()doesn't higlight in string attributes - Issue #320
FACETfails to sort on string attribute - Commit 4f1a Error in case of missing data dir
- Commit 04f4 access_* are not supported in RT mode
- Commit 1c06 Bad JSON objects in strings: 1.
CALL PQreturns "Bad JSON objects in strings: 1" when the json is greater than some value. - Commit 32f9 RT-mode inconsistency. In some cases I can't drop the index since it's unknown and can't create it since the directory is not empty.
- Issue #319 Crash on select
- Commit 22a2
max_xmlpipe2_field= 2M returned warning on 2M field - Issue #342 Query conditions execution bug
- Commit dd8d Simple 2 terms search finds a document containing only one term
- Commit 9091 It was impossible in PQ to match a json with capital letters in keys
- Commit 56da Indexer crashes on csv+docstore
- Issue #363 using
[null]in json attr in centos 7 causes corrupted inserted data - Major Issue #345 Records not being inserted, count() is random, "replace into" returns OK
- max_query_time slows down SELECTs too much
- Issue #352 Master-agent communication fails on Mac OS
- Issue #328 Error when connecting to Manticore with Connector.Net/Mysql 8.0.19
- Commit daa7 Fixed escaping of \0 and optimized performance
- Commit 9bc5 Fixed count distinct vs json
- Commit 4f89 Fixed drop table at other node failed
- Commit 952a Fix crashes on tightly running call pq
- Commit 2ffe fix RT index from old version fails to index data
- server works in 2 modes: rt-mode and plain-mode
- rt-mode requires data_dir and no index definition in config
- in plain-mode indexes are defined in config; no data_dir allowed
- replication available only in rt-mode
- charset_table defaults to non_cjk alias
- in rt-mode full-text fields are indexed and stored by default
- full-text fields in rt-mode renamed from 'field' to 'text'
- ALTER RTINDEX is renamed to ALTER TABLE
- TRUNCATE RTINDEX is renamed to TRUNCATE TABLE
- stored-only fields
- SHOW CREATE TABLE, IMPORT TABLE
- much faster lockless PQ
- /sql can execute any type of SQL statement in mode=raw
- alias mysql for mysql41 protocol
- default state.sql in data_dir
- Commit a533 fix crash on wrong field syntax in highlight()
- Commit 7fbb fix crash of server on replicate RT index with docstore
- Commit 24a0 fix crash on highlight to index with infix or prefix option and to index wo stored fields enabled
- Commit 3465 fix false error about empty docstore and dock-id lookup for empty index
- Commit a707 fix #314 SQL insert command with trailing semicolon
- Commit 9562 removed warning on query word(s) mismatch
- Commit b860 fix queries in snippets segmented via ICU
- Commit 5275 fix find/add race condition in docstore block cache
- Commit f06e fix mem leak in docstore
- Commit a725 fix #316 LAST_INSERT_ID returns empty on INSERT
- Commit 1ebd fix #317 json/update HTTP endpoint to support array for MVA and object for JSON attribute
- Commit e426 fix rash of indexer dumping rt without explicit id
- Parallel Real-Time index searching
- EXPLAIN QUERY command
- configuration file without index definitions (alpha version)
- CREATE/DROP TABLE commands (alpha version)
- indexer --print-rt - can read from a source and print INSERTs for a Real-Time index
- Updated to Snowball 2.0 stemmers
- LIKE filter for SHOW INDEX STATUS
- improved memory usage for high max_matches
- SHOW INDEX STATUS adds ram_chunks_count for RT indexes
- lockless PQ
- changed LimitNOFILE to 65536
- Commit 9c33 added check of index schema for duplicate attributes #293
- Commit a008 fix crash in hitless terms
- Commit 6895 fix loose docstore after ATTACH
- Commit d6f6 fix docstore issue in distributed setup
- Commit bce2 replace FixedHash with OpenHash in sorter
- Commit e0ba fix attributes with duplicated names at index definition
- Commit ca81 fix html_strip in HIGHLIGHT()
- Commit 493a fix passage macro in HIGHLIGHT()
- Commit a82d fix double buffer issues when RT index creates small or large disk chunk
- Commit a404 fix event deletion for kqueue
- Commit 8bea fix save of disk chunk for large value of rt_mem_limit of RT index
- Commit 8707 fix float overflow on indexing
- Commit a564 fix insert document with negative ID into RT index fails with error now
- Commit bbeb fix crash of server on ranker fieldmask
- Commit 3809 fix crash on using query cache
- Commit dc2a fix crash on using RT index RAM segments with parallel inserts
- Autoincrement ID for RT indexes
- Highlight support for docstore via new HIGHLIGHT() function, available also in HTTP API
- SNIPPET() can use special function QUERY() which returns current MATCH query
- new field_separator option for highlighting functions.
- lazy fetch of stored fields for remote nodes (can significantly increase performance)
- strings and expressions don't break anymore multi-query and FACET optimizations
- RHEL/CentOS 8 build now uses mysql libclient from mariadb-connector-c-devel
- ICU data file is now shipped with the packages, icu_data_dir removed
- systemd service files include 'Restart=on-failure' policy
- indextool can now check real-time indexes online
- default conf is now /etc/manticoresearch/manticore.conf
- service on RHEL/CentOS renamed to 'manticore' from 'searchd'
- removed query_mode and exact_phrase snippet's options
- Commit 6ae4 fix crash on SELECT query over HTTP interface
- Commit 5957 fix RT index saves disk chunks but does not mark some documents deleted
- Commit e861 fix crash on search of multi index or multi queries with dist_threads
- Commit 4409 fix crash on infix generation for long terms with wide utf8 codepoints
- Commit 5fd5 fix race at adding socket to IOCP
- Commit cf10 fix issue of bool queries vs json select list
- Commit 996d fix indextool check to report wrong skiplist offset, check of doc2row lookup
- Commit 6e3f fix indexer produces bad index with negative skiplist offset on large data
- Commit faed fix JSON converts only numeric to string and JSON string to numeric conversion at expressions
- Commit 5331 fix indextool exit with error code in case multiple commands set at command line
- Commit 7955 fix #275 binlog invalid state on error no space left on disk
- Commit 2284 fix #279 crash on IN filter to JSON attribute
- Commit ce2e fix #281 wrong pipe closing call
- Commit 5355 fix server hung at CALL PQ with recursive JSON attribute encoded as string
- Commit a5fc fix advancing beyond the end of the doclist in multiand node
- Commit a362 fix retrieving of thread public info
- Commit f8d2 fix docstore cache locks
- Document storage
- new directives stored_fields, docstore_cache_size, docstore_block_size, docstore_compression, docstore_compression_level
- improved SSL support
- non_cjk built-in charset updated
- disabled UPDATE/DELETE statements logging a SELECT in query log
- RHEL/CentOS 8 packages
- Commit 301a fix crash on replace document in disk chunk of RT index
- Commit 46c1 fix #269 LIMIT N OFFSET M
- Commit 92a4 fix DELETE statements with id explicitly set or id list provided to skip search
- Commit 8ca7 fix wrong index after event removed at netloop at windowspoll poller
- Commit 6036 fix float roundup at JSON via HTTP
- Commit 62f6 fix remote snippets to check empty path first; fixing windows tests
- Commit aba2 fix reload of config to work on windows same way as on linux
- Commit 6b8c fix #194 PQ to work with morphology and stemmers
- Commit 174d fix RT retired segments management
- Experimental SSL support for HTTP API
- field filter for CALL KEYWORDS
- max_matches for /json/search
- automatic sizing of default Galera gcache.size
- improved FreeBSD support
- Commit 0a1a fixed replication of RT index into node where same RT index exists and has different path
- Commit 4adc fix flush rescheduling for indexes without activity
- Commit d6c0 improve rescheduling of flushing RT/PQ indexes
- Commit d0a7 fix #250 index_field_lengths index option for TSV and CSV piped sources
- Commit 1266 fix indextool wrong report for block index check on empty index
- Commit 553c fix empty select list at Manticore SQL query log
- Commit 56c8 fix indexer -h/--help response
- replication for RealTime indexes
- ICU tokenizer for chinese
- new morphology option icu_chinese
- new directive icu_data_dir
- multiple statements transactions for replication
- LAST_INSERT_ID() and @session.last_insert_id
- LIKE 'pattern' for SHOW VARIABLES
- Multiple documents INSERT for percolate indexes
- Added time parsers for config
- internal task manager
- mlock for doc and hit lists components
- jail snippets path
- RLP library support dropped in favor of ICU; all rlp* directives removed
- updating document ID with UPDATE is disabled
- Commit f047 fix defects in concat and group_concat
- Commit b081 fix query uid at percolate index to be BIGINT attribute type
- Commit 4cd8 do not crash if failed to prealloc a new disk chunk
- Commit 1a55 add missing timestamp data type to ALTER
- Commit f3a8 fix crash of wrong mmap read
- Commit 4475 fix hash of clusters lock in replication
- Commit ff47 fix leak of providers in replication
- Commit 58dc fix #246 undefined sigmask in indexer
- Commit 3dd8 fix race in netloop reporting
- Commit a02a zero gap for HA strategies rebalancer
- added mmap readers for docs and hit lists
/sqlHTTP endpoint response is now the same as/json/searchresponse- new directives
access_plain_attrs,access_blob_attrs,access_doclists,access_hitlists - new directive
server_idfor replication setups
- removed HTTP
/searchendpoint
read_buffer,ondisk_attrs,ondisk_attrs_default,mlockare replaced byaccess_*directives
- Commit 849c allow attribute names starting with numbers in select list
- Commit 48e6 fixed MVAs in UDFs, fixed MVA aliasing
- Commit 0555 fixed #187 crash when using query with SENTENCE
- Commit 93bf fixed #143 support () around MATCH()
- Commit 599e fixed save of cluster state on ALTER cluster statement
- Commit 230c fixed crash of server on ALTER index with blob attributes
- Commit 5802 fixed #196 filtering by id
- Commit 25d2 discard searching on template indexes
- Commit 2a30 fixed id column to have regular bigint type at SQL reply
- New index storage. Non-scalar attributes are not limited anymore to 4GB size per index
- attr_update_reserve directive
- String,JSON and MVAs can be updated using UPDATE
- killlists are applied at index load time
- killlist_target directive
- multi AND searches speedup
- better average performance and RAM usage
- convert tool for upgrading indexes made with 2.x
- CONCAT() function
- JOIN CLUSTER cluster AT 'nodeaddress:port'
- ALTER CLUSTER posts UPDATE nodes
- node_address directive
- list of nodes printed in SHOW STATUS
- in case of indexes with killists, server doesn't rotate indexes in order defined in conf, but follows the chain of killlist targets
- order of indexes in a search no longer defines the order in which killlists are applied
- Document IDs are now signed big integers
- docinfo (always extern now), inplace_docinfo_gap, mva_updates_pool
- Galera replication for percolate indexes
- OPTION morphology
Cmake minimum version is now 3.13. Compiling requires boost and libssl development libraries.
- Commit 6967 fixed crash on many stars at select list for query into many distributed indexes
- Commit 36df fixed #177 large packet via Manticore SQL interface
- Commit 5793 fixed #170 crash of server on RT optimize with MVA updated
- Commit edb2 fixed server crash on binlog removed due to RT index remove after config reload on SIGHUP
- Commit bd3e fixed mysql handshake auth plugin payloads
- Commit 6a21 fixed #172 phrase_boundary settings at RT index
- Commit 3562 fixed #168 deadlock at ATTACH index to itself
- Commit 250b fixed binlog saves empty meta after server crash
- Commit 4aa6 fixed crash of server due to string at sorter from RT index with disk chunks
- SUBSTRING_INDEX()
- SENTENCE and PARAGRAPH support for percolate queries
- systemd generator for Debian/Ubuntu; also added LimitCORE to allow core dumping
- Commit 84fe fixed crash of server on match mode all and empty full text query
- Commit daa8 fixed crash on deleting of static string
- Commit 2207 fixed exit code when indextool failed with FATAL
- Commit 0721 fixed #109 no matches for prefixes due to wrong exact form check
- Commit 8af8 fixed #161 reload of config settings for RT indexes
- Commit e2d5 fixed crash of server on access of large JSON string
- Commit 75cd fixed PQ field at JSON document altered by index stripper causes wrong match from sibling field
- Commit e2f7 fixed crash of server at parse JSON on RHEL7 builds
- Commit 3a25 fixed crash of json unescaping when slash is on the edge
- Commit be9f fixed option 'skip_empty' to skip empty docs and not warn they're not valid json
- Commit 266e fixed #140 output 8 digits on floats when 6 is not enough to be precise
- Commit 3f6d fixed empty jsonobj creation
- Commit f3c7 fixed #160 empty mva outputs NULL instead of an empty string
- Commit 0afa fixed fail to build without pthread_getname_np
- Commit 9405 fixed crash on server shutdown with thread_pool workers
- Distributed indexes for percolate indexes
- CALL PQ new options and changes:
- skip_bad_json
- mode (sparsed/sharded)
- json documents can be passed as a json array
- shift
- Column names 'UID', 'Documents', 'Query', 'Tags', 'Filters' were renamed to 'id', 'documents', 'query', 'tags', 'filters'
- DESCRIBE pq TABLE
- SELECT FROM pq WHERE UID is not possible any more, use 'id' instead
- SELECT over pq indexes is on par with regular indexes (e.g. you can filter rules via REGEX())
- ANY/ALL can be used on PQ tags
- expressions have auto-conversion for JSON fields, not requiring explicit casting
- built-in 'non_cjk' charset_table and 'cjk' ngram_chars
- built-in stopwords collections for 50 languages
- multiple files in a stopwords declaration can also be separated by comma
- CALL PQ can accept JSON array of documents
- Commit a4e1 fixed csjon-related leak
- Commit 28d8 fixed crash because of missed value in json
- Commit bf4e fixed save of empty meta for RT index
- Commit 33b4 fixed lost form flag (exact) for sequence of lemmatizer
- Commit 6b95 fixed string attrs > 4M use saturate instead of overflow
- Commit 6214 fixed crash of server on SIGHUP with disabled index
- Commit 3f7e fixed server crash on simultaneous API session status commands
- Commit cd9e fixed crash of server at delete query to RT index with field filters
- Commit 9376 fixed crash of server at CALL PQ to distributed index with empty document
- Commit 8868 fixed cut Manticore SQL error message larger 512 chars
- Commit de9d fixed crash on save percolate index without binlog
- Commit 2b21 fixed http interface is not working in OSX
- Commit e92c fixed indextool false error message on check of MVA
- Commit 238b fixed write lock at FLUSH RTINDEX to not write lock whole index during save and on regular flush from rt_flush_period
- Commit c26a fixed ALTER percolate index stuck waiting search load
- Commit 9ee5 fixed max_children to use default amount of thread_pool workers for value of 0
- Commit 5138 fixed error on indexing of data into index with index_token_filter plugin along with stopwords and stopword_step=0
- Commit 2add fixed crash with absent lemmatizer_base when still using aot lemmatizers in index definitions
- REGEX function
- limit/offset for json API search
- profiler points for qcache
- Commit eb3c fixed crash of server on FACET with multiple attribute wide types
- Commit d915 fixed implicit group by at main select list of FACET query
- Commit 5c25 fixed crash on query with GROUP N BY
- Commit 85d3 fixed deadlock on handling crash at memory operations
- Commit 8516 fixed indextool memory consumption during check
- Commit 58fb fixed gmock include not needed anymore as upstream resolve itself
- SHOW THREADS in case of remote distributed indexes prints the original query instead of API call
- SHOW THREADS new option
format=sphinxqlprints all queries in SQL format - SHOW PROFILE prints additional
clone_attrsstage
- Commit 4f15 fixed failed to build with libc without malloc_stats, malloc_trim
- Commit f974 fixed special symbols inside words for CALL KEYWORDS result set
- Commit 0920 fixed broken CALL KEYWORDS to distributed index via API or to remote agent
- Commit fd68 fixed distributed index agent_query_timeout propagate to agents as max_query_time
- Commit 4ffa fixed total documents counter at disk chunk got affected by OPTIMIZE command and breaks weight calculation
- Commit dcaf fixed multiple tail hits at RT index from blended
- Commit eee3 fixed deadlock at rotation
- sort_mode option for CALL KEYWORDS
- DEBUG on VIP connection can perform 'crash
' for intentional SIGEGV action on server - DEBUG can perform 'malloc_stats' for dumping malloc stats in searchd.log 'malloc_trim' to perform a malloc_trim()
- improved backtrace is gdb is present on the system
- Commit 0f3c fixed crash or hfailure of rename on Windows
- Commit 1455 fixed crashes of server on 32-bit systems
- Commit ad37 fixed crash or hung of server on empty SNIPPET expression
- Commit b36d fixed broken non progressive optimize and fixed progressive optimize to not create kill-list for oldest disk chunk
- Commit 34b0 fixed queue_max_length bad reply for SQL and API at thread pool worker mode
- Commit ae4b fixed crash on adding full-scan query to PQ index with regexp or rlp options set
- Commit f80f fixed crash when call one PQ after another
- Commit 9742 refactor AcquireAccum
- Commit 39e5 fixed leak of memory after call pq
- Commit 21bc cosmetic refactor (c++11 style c-trs, defaults, nullptrs)
- Commit 2d69 fixed memory leak on trying to insert duplicate into PQ index
- Commit 5ed9 fixed crash on JSON field IN with large values
- Commit 4a52 fixed crash of server on CALL KEYWORDS statement to RT index with expansion limit set
- Commit 5526 fixed invalid filter at PQ matches query;
- Commit 204f introduce small obj allocator for ptr attrs
- Commit 2545 refactor ISphFieldFilter to refcounted flavour
- Commit 1366 fixed ub/sigsegv when using strtod on non-terminated strings
- Commit 94bc fixed memory leak in json resultset processing
- Commit e78e fixed read over the end of mem block applying attribute add
- Commit fad5 fixed refactor CSphDict for refcount flavour
- Commit fd84 fixed leak of AOT internal type outside
- Commit 5ee7 fixed memory leak tokenizer management
- Commit 116c fixed memory leak in grouper
- Commit 56fd special free/copy for dynamic ptrs in matches (memory leak grouper)
- Commit b1fc fixed memory leak of dynamic strings for RT
- Commit 517b refactor grouper
- Commit b1fc minor refactor (c++11 c-trs, some reformats)
- Commit 7034 refactor ISphMatchComparator to refcounted flavour
- Commit b1fc privatize cloner
- Commit efbc simplify native little-endian for MVA_UPSIZE, DOCINFO2ID_T, DOCINFOSETID
- Commit 6da0 add valgrind support to to ubertests
- Commit 1d17 fixed crash because race of 'success' flag on connection
- Commit 5a09 switch epoll to edge-triggered flavour
- Commit 5d52 fixed IN statement in expression with formatting like at filter
- Commit bd8b fixed crash at RT index on commit of document with large docid
- Commit ce65 fixed argless options in indextool
- Commit 08c9 fixed memory leak of expanded keyword
- Commit 30c7 fixed memory leak of json grouper
- Commit 6023 fixed leak of global user vars
- Commit 7c13 fixed leakage of dynamic strings on early rejected matches
- Commit 9154 fixed leakage on length(
) - Commit 43fc fixed memory leak because strdup() in parser
- Commit 71ff fixed refactor expression parser to accurate follow refcounts
- compatibility with MySQL 8 clients
- TRUNCATE WITH RECONFIGURE
- retired memory counter on SHOW STATUS for RT indexes
- global cache of multi agents
- improved IOCP on Windows
- VIP connections for HTTP protocol
- Manticore SQL DEBUG command which can run various subcommands
- shutdown_token - SHA1 hash of password needed to invoke
shutdownusing DEBUG command - new stats to SHOW AGENT STATUS (_ping, _has_perspool, _need_resolve)
- --verbose option of indexer now accept [debugvv] for printing debug messages
- Commit 3900 removed wlock at optimize
- Commit 4c33 fixed wlock at reload index settings
- Commit b5ea fixed memory leak on query with JSON filter
- Commit 930e fixed empty documents at PQ result set
- Commit 53de fixed confusion of tasks due to removed one
- Commit cad9 fixed wrong remote host counting
- Commit 9000 fixed memory leak of parsed agent descriptors
- Commit 978d fixed leak in search
- Commit 0193 cosmetic changes on explicit/inline c-trs, override/final usage
- Commit 943e fixed leak of json in local/remote schema
- Commit 02db fixed leak of json sorting col expr in local/remote schema
- Commit c74d fixed leak of const alias
- Commit 6e5b fixed leak of preread thread
- Commit 39c7 fixed stuck on exit because of stucked wait in netloop
- Commit adaf fixed stuck of 'ping' behaviour on change HA agent to usual host
- Commit 32c4 separate gc for dashboard storage
- Commit 511a fixed ref-counted ptr fix
- Commit 32c4 fixed indextool crash on unexistent index
- Commit 156e fixed output name of exceeding attr/field in xmlpipe indexing
- Commit cdac fixed default indexer's value if no indexer section in config
- Commit e61e fixed wrong embedded stopwords in disk chunk by RT index after server restart
- Commit 5fba fixed skip phantom (already closed, but not finally deleted from the poller) connections
- Commit f22a fixed blended (orphaned) network tasks
- Commit 4689 fixed crash on read action after write
- Commit 03f9 fixed searchd crashes when running tests on windows
- Commit e925 fixed handle EINPROGRESS code on usual connect()
- Commit 248b fixed connection timeouts when working with TFO
- improved wildcards performance on matching multiple documents at PQ
- support for fullscan queries at PQ
- support for MVA attributes at PQ
- regexp and RLP support for percolate indexes
- Commit 6885 fixed loose of query string
- Commit 0f17 fixed empty info at SHOW THREADS statement
- Commit 53fa fixed crash on matching with NOTNEAR operator
- Commit 2602 fixed error message on bad filter to PQ delete
- reduced number of syscalls to avoid Meltdown and Spectre patches impact
- internal rewrite of local index management
- remote snippets refactor
- full configuration reload
- all node connections are now independent
- proto improvements
- Windows communication switched from wsapoll to IO completion ports
- TFO can be used for communication between master and nodes
- SHOW STATUS now outputs to server version and mysql_version_string
- added
docs_idoption for documents called in CALL PQ. - percolate queries filter can now contain expressions
- distributed indexes can work with FEDERATED
- dummy SHOW NAMES COLLATE and
SET wait_timeout(for better ProxySQL compatibility)
- Commit 5bcf fixed added not equal to tags of PQ
- Commit 9ebc fixed added document id field to JSON document CALL PQ statement
- Commit 8ae0 fixed flush statement handlers to PQ index
- Commit c24b fixed PQ filtering on JSON and string attributes
- Commit 1b8b fixed parsing of empty JSON string
- Commit 1ad8 fixed crash at multi-query with OR filters
- Commit 69b8 fixed indextool to use config common section (lemmatizer_base option) for commands (dumpheader)
- Commit 6dbe fixed empty string at result set and filter
- Commit 39c4 fixed negative document id values
- Commit 266b fixed word clip length for very long words indexed
- Commit 4782 fixed matching multiple documents of wildcard queries at PQ
- MySQL FEDERATED engine support
- MySQL packets return now SERVER_STATUS_AUTOCOMMIT flag, adds compatibility with ProxySQL
- listen_tfo - enable TCP Fast Open connections for all listeners
- indexer --dumpheader can dump also RT header from .meta file
- cmake build script for Ubuntu Bionic
- Commit 355b fixed invalid query cache entries for RT index;
- Commit 546e fixed index settings got lost next after seamless rotation
- Commit 0c45 fixed fixed infix vs prefix length set; added warning on unsupportedinfix length
- Commit 8054 fixed RT indexes auto-flush order
- Commit 705d fixed result set schema issues for index with multiple attributes and queries to multiple indexes
- Commit b0ba fixed some hits got lost at batch insert with document duplicates
- Commit 4510 fixed optimize failed to merge disk chunks of RT index with large documents count
- jemalloc at compilation. If jemalloc is present on system, it can be enabled with cmake flag
-DUSE_JEMALLOC=1
- Commit 85a6 fixed log expand_keywords option into Manticore SQL query log
- Commit caaa fixed HTTP interface to correctly process query with large size
- Commit e386 fixed crash of server on DELETE to RT index with index_field_lengths enable
- Commit cd53 fixed cpustats searchd cli option to work with unsupported systems
- Commit 8740 fixed utf8 substring matching with min lengths defined
- improved Percolate Queries performance in case of using NOT operator and for batched documents.
- percolate_query_call can use multiple threads depending on dist_threads
- new full-text matching operator NOTNEAR/N
- LIMIT for SELECT on percolate indexes
- expand_keywords can accept 'start','exact' (where 'star,exact' has same effect as '1')
- ranged-main-query for joined fields which uses the ranged query defined by sql_query_range
- Commit 72dc fixed crash on searching ram segments; deadlock on save disk chunk with double buffer; deadlock on save disk chunk during optimize
- Commit 3613 fixed indexer crash on xml embedded schema with empty attribute name
- Commit 48d7 fixed erroneous unlinking of not-owned pid-file
- Commit a556 fixed orphaned fifos sometimes left in temp folder
- Commit 2376 fixed empty FACET result set with wrong NULL row
- Commit 4842 fixed broken index lock when running server as windows service
- Commit be35 fixed wrong iconv libs on mac os
- Commit 8374 fixed wrong count(*)
- agent_retry_count in case of agents with mirrors gives the value of retries per mirror instead of per agent, the total retries per agent being agent_retry_count*mirrors.
- agent_retry_count can now be specified per index, overriding global value. An alias mirror_retry_count is added.
- a retry_count can be specified in agent definition and the value represents retries per agent
- Percolate Queries are now in HTTP JSON API at /json/pq.
- Added -h and -v options (help and version) to executables
- morphology_skip_fields support for Real-Time indexes
- Commit a40b fixed ranged-main-query to correctly work with sql_range_step when used at MVA field
- Commit f2f5 fixed issue with blackhole system loop hung and blackhole agents seems disconnected
- Commit 84e1 fixed query id to be consistent, fixed duplicated id for stored queries
- Commit 1948 fixed server crash on shutdown from various states
- Commit 9a70 Commit 3495 timeouts on long queries
- Commit 3359 refactored master-agent network polling on kqueue-based systems (Mac OS X, BSD).
- HTTP JSON: JSON queries can now do equality on attributes, MVA and JSON attributes can be used in inserts and updates, updates and deletes via JSON API can be performed on distributed indexes
- Percolate Queries
- Removed support for 32-bit docids from the code. Also removed all the code that converts/loads legacy indexes with 32-bit docids.
- Morphology only for certain fields . A new index directive morphology_skip_fields allows defining a list of fields for which morphology does not apply.
- expand_keywords can now be a query runtime directive set using the OPTION statement
- Commit 0cfa fixed crash on debug build of server (and m.b. UB on release) when built with rlp
- Commit 3242 fixed RT index optimize with progressive option enabled that merges kill-lists with wrong order
- Commit ac0e minor crash on mac
- lots of minor fixes after thorough static code analysis
- other minor bugfixes
In this release we've changed internal protocol used by masters and agents to speak with each other. In case you run Manticoresearch in a distributed environment with multiple instances make sure your first upgrade agents, then the masters.
- JSON queries on HTTP API protocol. Supported search, insert, update, delete, replace operations. Data manipulation commands can be also bulked, also there are some limitations currently as MVA and JSON attributes can't be used for inserts, replaces or updates.
- RELOAD INDEXES command
- FLUSH LOGS command
- SHOW THREADS can show progress of optimize, rotation or flushes.
- GROUP N BY work correctly with MVA attributes
- blackhole agents are run on separate thread to not affect master query anymore
- implemented reference count on indexes, to avoid stalls caused by rotations and high load
- SHA1 hashing implemented, not exposed yet externally
- fixes for compiling on FreeBSD, macOS and Alpine
- Commit 9897 filter regression with block index
- Commit b1c3 rename PAGE_SIZE -> ARENA_PAGE_SIZE for compatibility with musl
- Commit f213 disable googletests for cmake < 3.1.0
- Commit f30e failed to bind socket on server restart
- Commit 0807 fixed crash of server on shutdown
- Commit 3e3a fixed show threads for system blackhole thread
- Commit 262c Refactored config check of iconv, fixes building on FreeBSD and Darwin
- OR operator in WHERE clause between attribute filters
- Maintenance mode ( SET MAINTENANCE=1)
- CALL KEYWORDS available on distributed indexes
- Grouping in UTC
- query_log_mode for custom log files permissions
- Field weights can be zero or negative
- max_query_time can now affect full-scans
- added net_wait_tm, net_throttle_accept and net_throttle_action for network thread fine tuning (in case of workers=thread_pool)
- COUNT DISTINCT works with facet searches
- IN can be used with JSON float arrays
- multi-query optimization is not broken anymore by integer/float expressions
- SHOW META shows a
multiplierrow when multi-query optimization is used
Manticore Search is built using cmake and the minimum gcc version required for compiling is 4.7.2.
- Manticore Search runs under
manticoreuser. - Default data folder is now
/var/lib/manticore/. - Default log folder is now
/var/log/manticore/. - Default pid folder is now
/var/run/manticore/.
- Commit a58c fixed SHOW COLLATION statement that breaks java connector
- Commit 631c fixed crashes on processing distributed indexes; added locks to distributed index hash; removed move and copy operators from agent
- Commit 942b fixed crashes on processing distributed indexes due to parallel reconnects
- Commit e5c1 fixed crash at crash handler on store query to server log
- Commit 4a4b fixed a crash with pooled attributes in multiqueries
- Commit 3873 fixed reduced core size by prevent index pages got included into core file
- Commit 11e6 fixed searchd crashes on startup when invalid agents are specified
- Commit 4ca6 fixed indexer reports error in sql_query_killlist query
- Commit 123a fixed fold_lemmas=1 vs hit count
- Commit cb99 fixed inconsistent behavior of html_strip
- Commit e406 fixed optimize rt index loose new settings; fixed optimize with sync option lock leaks;
- Commit 86ae fixed processing erroneous multiqueries
- Commit 2645 fixed result set depends on multi-query order
- Commit 7239 fixed server crash on multi-query with bad query
- Commit f353 fixed shared to exclusive lock
- Commit 3754 fixed server crash for query without indexes
- Commit 29f3 fixed dead lock of server
- Manticore branding
Unfortunately, Manticore is not yet 100% bug-free (although we are working hard towards that goal). You may occasionally encounter some issues.
It is very important to report as much information as possible about each bug. To fix a bug, we need to either reproduce and fix it or deduce what is causing it based on the information you provide. Therefore, here are some instructions on how to do that.
We track bugs and feature requests on Github. Feel free to create a new ticket and describe your bug in detail so that you and the developers can save time.
Updates to the documentation (what you are reading now) are also done on Github.
Manticore is written in C++, a low-level programming language that allows for direct communication with the computer for faster performance. The drawback of that is that in rare cases, it may not be possible to elegantly handle a bug by writing an error to a log and skipping the processing of the command that caused the problem. Instead, the program may crash, which means it will stop completely and need to be restarted.
When Manticore Search crashes, you need to let the Manticore team know about it by making a bug report on GitHub, or if you use Manticore's professional services in your private helpdesk. The Manticore team needs the following information:
- Searchd log
- Coredump
- Query log
It will be great if you additionally do the following:
- Run gdb to inspect the coredump:
gdb /usr/bin/searchd </path/to/coredump> - Find crashed thread id in the coredump file name (make sure you have
%pin /proc/sys/kernel/core_pattern), e.g.core.work_6.29050.server_name.1637586599means thread_id=29050 - In gdb run:
set pagination off info threads # find thread number by it's id (e.g. for `LWP 29050` it will be thread number 8 thread apply all bt thread <thread number> bt full info locals quit - Provide the outputs
You need to run gdb manually and collect some info that may be useful to understand why it's hanging.
show threads option format=allrun trough a VIP port- collect lsof output since hanging can be caused by too many connections or open file descriptors
lsof -p `cat /var/run/manticore/searchd.pid` - dump core
gcore `cat /var/run/manticore/searchd.pid`(it will save the dump to the current dir)
- Install and run gdb:
gdb /usr/bin/searchd `cat /var/run/manticore/searchd.pid`Note it will halt your running searchd, but if it's alredy hanging it shouldn't be a problem.
- In gdb run:
set pagination off info threads thread apply all bt quit - Collect all the outputs and files and provide them in a bug report.
For experts: the macros added in this commit can be helpful to debug.
- make sure you run searchd with
--coredump. To avoid hacking the scripts you can use this https://manual.manticoresearch.com/Starting_the_server/Linux#Custom-startup-flags-using-systemd , e.g.:
[root@srv lib]# systemctl set-environment _ADDITIONAL_SEARCHD_PARAMS='--coredump'
[root@srv lib]# systemctl restart manticore
[root@srv lib]# ps aux|grep searchd
mantico+  1955  0.0  0.0  61964  1580 ?        S    11:02   0:00 /usr/bin/searchd --config /etc/manticoresearch/manticore.conf --coredump
mantico+ 1956 0.6 0.0 392744 2664 ? Sl 11:02 0:00 /usr/bin/searchd --config /etc/manticoresearch/manticore.conf --coredump- make sure that your OS allows you to save coredumps:
/proc/sys/kernel/core_patternshould be non-empty - this is where it will save them. If you do:echo "/cores/core.%e.%p.%h.%t" > /proc/sys/kernel/core_patternit will instruct your kernel to save them to file like
core.searchd.1773.centos-4gb-hel1-1.1636454937 - searchd should be started with
ulimit -c unlimited, but if you start Manticore via systemctl it does it for yourself since it does:[root@srv lib]# grep CORE /lib/systemd/system/manticore.service LimitCORE=infinity
Manticore Search and Manticore Columnar Library are written in C++, which means that when you run them, you get a compiled, compact binary file that executes optimally on your operating system. However, when you run a binary, your system does not have full access to the names of variables, functions, methods, and classes that are implemented. All of this information is provided separately in something called "debuginfo" or "symbol packages."
Debug symbols are useful for troubleshooting and other debugging purposes, as they allow you to visualize the state of the system when it crashed, including the names of functions, when you have symbols and your binary crashes. Manticore Search provides a backtrace in the searchd log and also generates a coredump if it was run with the --coredump flag. Without symbols, all you get is internal offsets, which can be difficult or impossible to decode. Therefore, if you need to make a bug report about a crash, the Manticore team will often need debug symbols in order to help you.
To install Manticore Search/Manticore Columnar Library debug symbols, you will need to install the *debuginfo* package for CentOS, the *dbgsym* package for Ubuntu and Debian, or the *dbgsymbols* package for Windows and macOS. These packages should be of the same version as the version of Manticore that you are running. For example, if you've installed Manticore Search in Centos 8 from the package https://repo.manticoresearch.com/repository/manticoresearch/release/centos/8/x86_64/manticore-4.0.2_210921.af497f245-1.el8.x86_64.rpm , the corresponding package with symbols would be https://repo.manticoresearch.com/repository/manticoresearch/release/centos/8/x86_64/manticore-debuginfo-4.0.2_210921.af497f245-1.el8.x86_64.rpm
Note that both packages have the same commit id af497f245, which corresponds to the commit that this version was built from.
If you have installed Manticore from a Manticore APT/YUM repository, you can use one of the following tools:
debuginfo-installin CentOS 7dnf debuginfo-installCentOS 8find-dbgsym-packagesin Debian and Ubuntu
to find a debug symbols package for you.
- Find build id in
file /usr/bin/searchdoutput:
[root@srv lib]# file /usr/bin/searchd
/usr/bin/searchd: ELF 64-bit LSB executable, x86-64, version 1 (GNU/Linux), dynamically linked (uses shared libs), for GNU/Linux 2.6.32, BuildID[sha1]=2c582e9f564ea1fbeb0c68406c271ba27034a6d3, stripped
In this case it's 2c582e9f564ea1fbeb0c68406c271ba27034a6d3.
- Find symbols in
/usr/lib/debug/.build-idlike this:
[root@srv ~]# ls -la /usr/lib/debug/.build-id/2c/582e9f564ea1fbeb0c68406c271ba27034a6d3*
lrwxrwxrwx. 1 root root 23 Nov  9 10:42 /usr/lib/debug/.build-id/2c/582e9f564ea1fbeb0c68406c271ba27034a6d3 -> ../../../../bin/searchd
lrwxrwxrwx. 1 root root 27 Nov 9 10:42 /usr/lib/debug/.build-id/2c/582e9f564ea1fbeb0c68406c271ba27034a6d3.debug -> ../../usr/bin/searchd.debugTo fix your bug, developers often need to reproduce it locally. To do this, they need your configuration file, table files, binlog (if present), and sometimes source data (such as data from external storages or XML/CSV files) and queries.
Attach your data when you create a ticket on Github. If it is too large or the data is sensitive, you can feel free to upload it to our write-only S3 storage s3://s3.manticoresearch.com/write-only/. Here's how you can do it using Minio client:
- Install the client https://min.io/docs/minio/linux/reference/minio-mc.html#install-mc
- Add our s3 host:
mc config host add manticore http://s3.manticoresearch.com:9000 manticore manticore - Copy your files:
mc cp -r issue-1234/ manticore/write-only/issue-1234. Make sure you make the folder name unique, best if it corresponds to the issue on GitHub where you described the bug
DEBUG [ subcommand ]DEBUG statement is designed to call different internal or vip commands for dev/testing purposes. It is not intended for production automation, since the syntax of subcommand part may be freely changed in any build.
Call DEBUG without params to show a list of useful commands (in general) and subcommands (of DEBUG statement) available at the current context.
mysql> debug;
+-------------------------------------------------------------------------+----------------------------------------------------------------------------------------+
| command                                                                 | meaning                                                                                |
+-------------------------------------------------------------------------+----------------------------------------------------------------------------------------+
| flush logs                                                              | emulate USR1 signal                                                                    |
| reload indexes                                                          | emulate HUP signal                                                                     |
| debug token <password>                                                  | calculate token for password                                                           |
| debug malloc_stats                                                      | perform 'malloc_stats', result in searchd.log                                          |
| debug malloc_trim                                                       | pefrorm 'malloc_trim' call                                                             |
| debug sleep <N>                                                         | sleep for <N> seconds                                                                  |
| debug tasks                                                             | display global tasks stat (use select from @@system.tasks instead)                     |
| debug sched                                                             | display task manager schedule (use select from @@system.sched instead)                 |
| debug merge <TBL> [chunk] <X> [into] [chunk] <Y> [option sync=1,byid=0] | For RT table <TBL> merge disk chunk X into disk chunk Y                                |
| debug drop [chunk] <X> [from] <TBL> [option sync=1]                     | For RT table <TBL> drop disk chunk X                                                   |
| debug files <TBL> [option format=all|external]                          | list files belonging to <TBL>. 'all' - including external (wordforms, stopwords, etc.) |
| debug close                                                             | ask server to close connection from it's side                                          |
| debug compress <TBL> [chunk] <X> [option sync=1]                        | Compress disk chunk X of RT table <TBL> (wipe out deleted documents)                   |
| debug split <TBL> [chunk] <X> on @<uservar> [option sync=1]             | Split disk chunk X of RT table <TBL> using set of DocIDs from @uservar                 |
| debug wait <cluster> [like 'xx'] [option timeout=3]                     | wait <cluster> ready, but no more than 3 secs.                                         |
| debug wait <cluster> status <N> [like 'xx'] [option timeout=13]         | wait <cluster> commit achieve <N>, but no more than 13 secs                            |
| debug meta                                                              | Show max_matches/pseudo_shards. Needs set profiling=1                                  |
| debug trace OFF|'path/to/file' [<N>]                                    | trace flow to file until N bytes written, or 'trace OFF'                               |
| debug curl <URL>                                                        | request given url via libcurl                                                          |
+-------------------------------------------------------------------------+----------------------------------------------------------------------------------------+
19 rows in set (0.00 sec)
Same from VIP connection:
mysql> debug;
+-------------------------------------------------------------------------+----------------------------------------------------------------------------------------+
| command                                                                 | meaning                                                                                |
+-------------------------------------------------------------------------+----------------------------------------------------------------------------------------+
| flush logs                                                              | emulate USR1 signal                                                                    |
| reload indexes                                                          | emulate HUP signal                                                                     |
| debug shutdown <password>                                               | emulate TERM signal                                                                    |
| debug crash <password>                                                  | crash daemon (make SIGSEGV action)                                                     |
| debug token <password>                                                  | calculate token for password                                                           |
| debug malloc_stats                                                      | perform 'malloc_stats', result in searchd.log                                          |
| debug malloc_trim                                                       | pefrorm 'malloc_trim' call                                                             |
| debug procdump                                                          | ask watchdog to dump us                                                                |
| debug setgdb on|off                                                     | enable or disable potentially dangerous crash dumping with gdb                         |
| debug setgdb status                                                     | show current mode of gdb dumping                                                       |
| debug sleep <N>                                                         | sleep for <N> seconds                                                                  |
| debug tasks                                                             | display global tasks stat (use select from @@system.tasks instead)                     |
| debug sched                                                             | display task manager schedule (use select from @@system.sched instead)                 |
| debug merge <TBL> [chunk] <X> [into] [chunk] <Y> [option sync=1,byid=0] | For RT table <TBL> merge disk chunk X into disk chunk Y                                |
| debug drop [chunk] <X> [from] <TBL> [option sync=1]                     | For RT table <TBL> drop disk chunk X                                                   |
| debug files <TBL> [option format=all|external]                          | list files belonging to <TBL>. 'all' - including external (wordforms, stopwords, etc.) |
| debug close                                                             | ask server to close connection from it's side                                          |
| debug compress <TBL> [chunk] <X> [option sync=1]                        | Compress disk chunk X of RT table <TBL> (wipe out deleted documents)                   |
| debug split <TBL> [chunk] <X> on @<uservar> [option sync=1]             | Split disk chunk X of RT table <TBL> using set of DocIDs from @uservar                 |
| debug wait <cluster> [like 'xx'] [option timeout=3]                     | wait <cluster> ready, but no more than 3 secs.                                         |
| debug wait <cluster> status <N> [like 'xx'] [option timeout=13]         | wait <cluster> commit achieve <N>, but no more than 13 secs                            |
| debug meta                                                              | Show max_matches/pseudo_shards. Needs set profiling=1                                  |
| debug trace OFF|'path/to/file' [<N>]                                    | trace flow to file until N bytes written, or 'trace OFF'                               |
| debug curl <URL>                                                        | request given url via libcurl                                                          |
+-------------------------------------------------------------------------+----------------------------------------------------------------------------------------+
24 rows in set (0.00 sec)
All debug XXX commands should be regarded as non-stable and subject to modification at any time, so don't be surprised if they change. This example output may not reflect the actual available commands, so try it on your system to see what is available on your instance. Additionally, there is no detailed documentation provided aside from this short 'meaning' column.
As a quick illustration, two commands available only to VIP clients are described below - shutdown and crash. Both require a token, which can be generated with the debug token subcommand, and added to the shutdown_token param in the searchd section of the config file. If no such section exists, or if the provided password hash does not match the token stored in the config, the subcommands will do nothing.
mysql> debug token hello;
+-------------+------------------------------------------+
| command     | result                                   |
+-------------+------------------------------------------+
| debug token | aaf4c61ddcc5e8a2dabede0f3b482cd9aea9434d |
+-------------+------------------------------------------+
1 row in set (0,00 sec)
The subcommand shutdown will send a TERM signal to the server, causing it to shut down. This can be dangerous, as nobody wants to accidentally stop a production service. Therefore, it requires a VIP connection and the password to be used.
The subcommand crash literally causes a crash. It may be used for testing purposes, such as to test how the system manager maintains the service's liveness or to test the feasibility of tracking coredumps.
If some commands are found to be useful in a more general context, they may be moved from the debug subcommands to a more stable and generic location (as exemplified by the debug tasks and debug sched in the table).
- CREATE TABLE - Creates new table
- CREATE TABLE LIKE - Creates table using another one as a template
- DESCRIBE - Prints out table's field list and their types
- ALTER TABLE - Changes table schema / settings
- ALTER TABLE REBUILD SECONDARY - Updates/recovers secondary indexes
- DROP TABLE IF EXISTS - Deletes a table (if it exists)
- SHOW TABLES - Shows tables list
- SHOW CREATE TABLE - Shows SQL command how to create the table
- SHOW TABLE STATUS - Shows information about current table status
- SHOW TABLE SETTINGS - Shows table settings
- INSERT - Adds new documents
- REPLACE - Replaces existing documents with new ones
- UPDATE - Does in-place update in documents
- DELETE - Deletes documents
- TRUNCATE TABLE - Deletes all documents from table
- BACKUP - Backs up your tables
- SELECT - Searches
- WHERE - Filters
- GROUP BY - Groups search results
- GROUP BY ORDER - Orders groups
- GROUP BY HAVING - Filters groups
- OPTION - Query Options
- FACET - Faceted search
- SUB-SELECTS - About using SELECT sub-queries
- EXPLAIN QUERY - Shows query execution plan without running the query itself
- SHOW META - Shows extended information about executed query
- SHOW PROFILE - Shows profiling information about executed query
- SHOW PLAN - Shows query execution plan after the query was executed
- SHOW WARNINGS - Shows warnings from the latest query
- FLUSH ATTRIBUTES - Forces flushing updated attributes to disk
- FLUSH HOSTNAMES - Renews IPs associates to agent host names
- FLUSH LOGS - Initiates reopen of searchd log and query log files (similar to USR1)
- FLUSH RAMCHUNK - Force creating a new disk chunk
- FLUSH TABLE - Flushes real-time table RAM chunk to disk
- OPTIMIZE TABLE - Enqueues real-time table for optimization
- ATTACH TABLE - Moves data from a plain table to a real-time table
- IMPORT TABLE - Imports previously created RT or PQ table into a server running in the RT mode
- JOIN CLUSTER - Joins a replication cluster
- ALTER CLUSTER - Adds/deletes a table to a replication cluster
- SET CLUSTER - Changes replication cluster settings
- DELETE CLUSTER - Deletes a replication cluster
- RELOAD TABLE - Rotates a plain table
- RELOAD TABLES - Rotates all plain tables
- CALL SUGGEST, CALL QSUGGEST - Suggests spell-corrected words
- CALL SNIPPETS - Builds a highlighted results snippet from provided data and query
- CALL PQ - Runs a percolate query
- CALL KEYWORDS - Used to check how keywords are tokenized. Also allows to retrieve tokenized forms of provided keywords
- CREATE FUNCTION - Installs a user-defined function (UDF)
- DROP FUNCTION - Drops a user-defined function (UDF)
- CREATE PLUGIN - Installs a plugin
- DROP PLUGIN - Drops a plugin
- RELOAD PLUGINS - Reloads all plugins from a given library
- SHOW STATUS - Displays a number of useful performance counters
- SHOW THREADS - Lists all currently active client threads
- SHOW VARIABLES - Lists server-wide variables and their values
- /sql - Allows running an SQL statement over HTTP
- /cli - HTTP command line interface
- /insert - Inserts a document into a real-time table
- /pq/tbl_name/doc - Inserts a PQ rule into a percolate table
- /update - Updates a document in a real-time table
- /replace - Replaces a document in a real-time table
- /pq/tbl_name/doc/N?refresh=1 - Replaces a PQ rule in a percolate table
- /delete - Deletes a document in a table
- /bulk - Perform several insert, update or delete operations in a single call. More about bulk inserts here.
- /search - Performs search
- /pq/tbl_name/search - Performs reverse search in a percolate table
- access_plain_attrs
- access_blob_attrs
- access_doclists
- access_hitlists
- attr_update_reserve
- bigram_freq_words
- bigram_index
- blend_chars
- blend_mode
- charset_table
- dict
- docstore_block_size
- docstore_compression
- docstore_compression_level
- embedded_limit
- exceptions
- expand_keywords
- global_idf
- hitless_words
- html_index_attrs
- html_remove_elements
- html_strip
- ignore_chars
- index_exact_words
- index_field_lengths
- index_sp
- index_token_filter
- index_zones
- infix_fields
- inplace_enable
- inplace_hit_gap
- inplace_reloc_factor
- inplace_write_factor
- killlist_target
- max_substring_len
- min_infix_len
- min_prefix_len
- min_stemming_len
- min_word_len
- morphology
- morphology_skip_fields
- ngram_chars
- ngram_len
- overshort_step
- path
- phrase_boundary
- phrase_boundary_step
- prefix_fields
- preopen
- read_buffer_docs
- read_buffer_hits
- regexp_filter
- stopwords
- stopword_step
- stopwords_unstemmed
- type
- wordforms
- local
- agent
- agent_connect_timeout
- agent_blackhole
- agent_persistent
- agent_query_timeout
- agent_retry_count
- ha_strategy
- mirror_retry_count
- rt_attr_bigint
- rt_attr_bool
- rt_attr_float
- rt_attr_json
- rt_attr_multi_64
- rt_attr_multi
- rt_attr_string
- rt_attr_timestamp
- rt_attr_uint
- rt_field
- rt_mem_limit
- OR
- MAYBE
- NOT - operator NOT
- @field - field search operator
- @field[N] - field position limit modifier
- @(field1,field2,...) - multiple-field search operator
- @!field - ignore field search operator
- @!(field1,field2,...) - ignore multiple-field search operator
- @* - all-field search operator
- "word1 word2 ... " - phrase search operator
- "word1 word2 ... "~N - proximity search operator
- "word1 word2 ... "/N - quorum matching operator
- word1 <<< word2 <<< word3 - strict order operator
- =word1 - exact form modifier
- ^word1 - field-start modifier
- word2$ - field-end modifier
- word^N - keyword IDF boost modifier
- word1 NEAR/N word2 - NEAR, generalized proximity operator
- word1 NOTNEAR/N word2 - NOTNEAR, negative assertion operator
- word1 SENTENCE word2 SENTENCE "word3 word4" - SENTENCE operator
- word1 PARAGRAPH word2 PARAGRAPH "word3 word4" - PARAGRAPH operator
- ZONE:(h3,h4) - ZONE limit operator
- ZONESPAN:(h2) - ZONESPAN limit operator
- @@relaxed - suppresses errors about missing fields
- ABS() - Returns absolute value
- ATAN2() - Returns arctangent function of two arguments
- BITDOT() - Returns sum of products of an each bit of a mask multiplied with its weight
- CEIL() - Returns smallest integer value greater or equal to the argument
- COS() - Returns cosine of the argument
- CRC32() - Returns CRC32 value of the argument
- EXP() - Returns exponent of the argument
- FIBONACCI() - Returns the N-th Fibonacci number, where N is the integer argument
- FLOOR() - Returns the largest integer value lesser or equal to the argument
- GREATEST() - Takes JSON/MVA array as the argument and returns the greatest value in that array
- IDIV() - Returns result of an integer division of the first argument by the second argument
- LEAST() - Takes JSON/MVA array as the argument, and returns the least value in that array
- LN() - Returns natural logarithm of the argument
- LOG10() - Returns common logarithm of the argument
- LOG2() - Returns binary logarithm of the argument
- MAX() - Returns the bigger of two arguments
- MIN() - Returns the smaller of two arguments
- POW() - Returns the first argument raised to the power of the second argument
- RAND() - Returns random float between 0..1
- SIN() - Returns sine of the argument
- SQRT() - Returns square root of the argument
- BM25F() - Returns precise BM25F formula value
- EXIST() - Replaces non-existing columns with default values
- GROUP_CONCAT() - Produces a comma-separated list of the attribute values of all documents in the group
- HIGHLIGHT() - Highlights search results
- MIN_TOP_SORTVAL() - Returns sort key value of the worst found element in the current top-N matches
- MIN_TOP_WEIGHT() - Returns weight of the worst found element in the current top-N matches
- PACKEDFACTORS() - Outputs weighting factors
- REMOVE_REPEATS() - Removes repeated adjusted rows with the same 'column' value
- WEIGHT() - Returns fulltext match score
- ZONESPANLIST() - Returns pairs of matched zone spans
- QUERY() - Returns current full-text query
- BIGINT() - Forcibly promotes the integer argument to 64-bit type
- DOUBLE() - Forcibly promotes given argument to floating point type
- INTEGER() - Forcibly promotes given argument to 64-bit signed type
- TO_STRING() - Forcibly promotes the argument to string type
- UINT() - Forcibly reinterprets given argument to 64-bit unsigned type
- SINT() - Interprets 32-bit unsigned integer as signed 64-bit integer
- ALL() - Returns 1 if condition is true for all elements in the array
- ANY() - Returns 1 if condition is true for any element in the array
- CONTAINS() - Checks whether the (x,y) point is within the given polygon
- IF() - Checks whether the 1st argument is equal to 0.0, returns the 2nd argument if it is not zero or the 3rd one when it is
- IN() - Returns 1 if the first argument is equal to any of the other arguments, or 0 otherwise
- INDEXOF() - Iterates through all elements in the array and returns index of the first matching element
- INTERVAL() - Returns index of the argument that is less than the first argument
- LENGTH() - Returns number of elements in MVA
- REMAP() - Allows to make some exceptions of expression values depending on the condition values
- NOW() - Returns current timestamp as an INTEGER
- CURTIME() - Returns current time in local timezone
- UTC_TIME() - Returns current time in UTC timezone
- UTC_TIMESTAMP() - Returns current date/time in UTC timezone
- SECOND() - Returns integer second from the timestamp argument
- MINUTE() - Returns integer minute from the timestamp argument
- HOUR() - Returns integer hour from the timestamp argument
- DAY() - Returns integer day from the timestamp argument
- MONTH() - Returns integer month from the timestamp argument
- YEAR() - Returns integer year from the timestamp argument
- YEARMONTH() - Returns integer year and month code from the timestamp argument
- YEARMONTHDAY() - Returns integer year, month and day code from the timestamp argument
- TIMEDIFF() - Returns difference between the timstamps
- GEODIST() - Computes geosphere distance between two given points
- GEOPOLY2D() - Creates a polygon that takes in account the Earth's curvature
- POLY2D() - Creates a simple polygon in plain space
- CONCAT() - Concatenates two or more strings
- REGEX() - Returns 1 if regular expression matched to string of attribute and 0 otherwise
- SNIPPET() - Highlights search results
- SUBSTRING_INDEX() - Returns a substring of the string before the specified number of delimiter occurs
- LAST_INSERT_ID() - Returns ids of documents inserted or replaced by last statement in the current session
To be put to section common {} in configuration file:
- lemmatizer_base - Lemmatizer dictionaries base path
- progressive_merge - Defines order of merging disk chunks in a real-time table
- json_autoconv_keynames - Whether and how to auto-convert key names within JSON attributes
- json_autoconv_numbers - Automatically detects and converts possible JSON strings that represent numbers into numeric attributes
- on_json_attr_error - What to do if JSON format errors are found
- plugin_dir - Location for the dynamic libraries and UDFs
indexer is a tool to create plain tables
To be put to section indexer {} in configuration file:
- lemmatizer_cache - Lemmatizer cache size
- max_file_field_buffer - Maximum file field adaptive buffer size
- max_iops - Maximum indexation I/O operations per second
- max_iosize - Maximum allowed I/O operation size
- max_xmlpipe2_field - Maximum allowed field size for XMLpipe2 source type
- mem_limit - Indexing RAM usage limit
- on_file_field_error - How to handle IO errors in file fields
- write_buffer - Write buffer size
- ignore_non_plain - To ignore warnings about non-plain tables
indexer [OPTIONS] [indexname1 [indexname2 [...]]]- --all - Rebuilds all tables from the config
- --buildstops - Reviews the table source, as if it were indexing the data, and produces a list of the terms that are being indexed.
- --buildfreqs - Adds the quantity present in the table for --buildstops
- --config, -c - Path to configuration file
- --dump-rows - Dumps rows fetched by SQL source(s) into the specified file
- --help - Lists all the parameters
- --keep-attrs - Allows to reuse existing attributes on reindexing
- --keep-attrs-names - Allows to specify attributes to reuse from the existing table
- --merge-dst-range - Runs the filter range given upon merging
- --merge-killlists - Changes the way kill lists are processed when merging tables
- --merge - Merges two plain tables into one
- --nohup - Indexer won't send SIGHUP if this option is on
- --noprogress - Prevents displaying progress details
- --print-queries - Prints out SQL queries that indexer sends to the database
- --print-rt - Outputs data fetched from sql source(s) as INSERTs to a real-time table
- --quiet - Prevents displaying anything
- --rotate - Forces tables rotation after all the tables are built
- --sighup-each - Forces rotation of each table after it's built
- -v - Shows indexer version
index_converter is a tool for converting tables created with Sphinx/Manticore Search 2.x to Manticore Search 3.x table format.
index_converter {--config /path/to/config|--path}- --config, -c - Path to tables configuration file
- --index - Specifies which table should be converted
- --path - Defines path containing table(s) instead of the configuration file
- --strip-path - Strips path from filenames referenced by table
- --large-docid - Allows to convert documents with ids larger than 2^63
- --output-dir - Writes the new files in a chosen folder
- --all - Converts all tables from the configuration file / path
- --killlist-target - Sets the target tables for which kill-lists will be applied
searchd is a Manticore server.
To be put to section searchd {} in configuration file:
- access_blob_attrs - Specifies how table's blob attributes file is accessed
- access_doclists - Specifies how table's doclists file is accessed
- access_hitlists - Specifies how table's hitlists file is accessed
- access_plain_attrs - Specifies how search server will access table's plain attributes
- agent_connect_timeout - Remote agent connection timeout
- agent_query_timeout - Remote agent query timeout
- agent_retry_count - Specifies how many times Manticore will try to connect and query remote agents
- agent_retry_delay - Specifies the delay before retrying to query a remote agent in case it fails
- attr_flush_period - Defines time period between flushing updated attributes to disk
- binlog_flush - Binary log transaction flush/sync mode
- binlog_max_log_size - Maximum binary log file size
- binlog_path - Binary log files path
- client_timeout - Maximum time to wait between requests when using persistent connections
- collation_libc_locale - Server libc locale
- collation_server - Default server collation
- data_dir - Path to data directory where Manticore stores everything (RT mode)
- docstore_cache_size - Maximum size of document blocks from document storage that are held in memory
- expansion_limit - Maximum number of expanded keywords for a single wildcard
- grouping_in_utc - Turns on using UTC timezone where grouping time fields
- ha_period_karma - Agent mirror statistics window size
- ha_ping_interval - Interval between agent mirror pings
- hostname_lookup - Hostnames renew strategy
- jobs_queue_size - Defines how many "jobs" can be in the queue at the same time
- listen - Specifies IP address and port or Unix-domain socket path, that searchd will listen on
- listen_backlog - TCP listen backlog
- listen_tfo - Allows TCP_FASTOPEN flag for all listeners
- log - Path to Manticore server log file
- max_batch_queries - Limits the amount of queries per batch
- max_connections - Maximum amount of active connections
- max_filters - Maximum allowed per-query filter count
- max_filter_values - Maximum allowed per-filter values count
- max_open_files - Maximum num of files which allowed to be opened by server
- max_packet_size - Maximum allowed network packet size
- mysql_version_string - Server version string to return via MySQL protocol
- net_throttle_accept - Defines how many clients are accepted on each iteration of the network loop
- net_throttle_action - Defines how many requests are processed on each iteration of the network loop
- net_wait_tm - Controls busy loop interval of a network thread
- net_workers - Number of network threads
- network_timeout - Network timeout for requests from clients
- node_address - Specifies network address of the node
- persistent_connections_limit - Maximum number of simultaneous persistent connections to remote persistent agents
- pid_file - Path to Manticore server pid file
- predicted_time_costs - Costs for the query time prediction model
- preopen_indexes - Whether to forcibly preopen all tables on startup
- pseudo_sharding - Enables pseudo-sharding for search queries to plain and real-time tables
- qcache_max_bytes - Maximum RAM allocated for cached result sets
- qcache_thresh_msec - Minimum wall time threshold for a query result to be cached
- qcache_ttl_sec - Expiration period for a cached result set
- query_log - Path to query log file
- query_log_format - Query log format
- query_log_min_msec - Prevents logging too fast queries
- query_log_mode - Query log file permissions mode
- read_buffer_docs - Per-keyword read buffer size for document lists
- read_buffer_hits - Per-keyword read buffer size for hit lists
- read_unhinted - Unhinted read size
- rt_flush_period - How often Manticore flush real-time tables' RAM chunks to disk
- rt_merge_iops - Maximum number of I/O operations (per second) that real-time chunks merging thread is allowed to do
- rt_merge_maxiosize - Maximum size of an I/O operation that real-time chunks merging thread is allowed to do
- seamless_rotate - Prevents searchd stalls while rotating tables with huge amounts of data to precache
- secondary_indexes - Enables using secondary indexes for search queries
- server_id - Server identifier used as a seed to generate a unique document ID
- shutdown_timeout - Searchd
--stopwaittimeout - shutdown_token - SHA1 hash of the password required to invoke
shutdowncommand from VIP SQL connection - snippets_file_prefix - Prefix to prepend to the local file names when generating snippets in
load_filesmode - sphinxql_state - Path to file where current SQL state will be serialized
- sphinxql_timeout - Maximum time to wait between requests from a mysql client
- ssl_ca - Path to SSL Certificate Authority certificate file
- ssl_cert - Path to server's SSL certificate
- ssl_key - Path to SSL certificate key of the server
- subtree_docs_cache - Maximum common subtree document cache size
- subtree_hits_cache - Maximum common subtree hit cache size, per-query
- thread_stack - Maximum stack size for a job
- unlink_old - Whether to unlink .old table copies on successful rotation
- watchdog - Whether to enable or disable Manticore server watchdog
searchd [OPTIONS]- --config, -c - Path to configuration file
- --console - Forces running in console mode
- --coredump - Enables saving core dump on crash
- --cpustats - Enables CPU time reporting
- --delete - Removes Manticore service from Microsoft Management Console and other places where the services are registered
- --force-preread - Forbids the server to serve any incoming connection until pre-reading of the table files completes
- --help, -h - Lists all the parameters
- --table (--index) - Forces serving only the specified table
- --install - Installs searchd as a service into Microsoft Management Console
- --iostats - Enables input/output reporting
- --listen, -l - Overrides listen from the configuration file
- --logdebug, --logdebugv, --logdebugvv - Enables additional debug output in the server log
- --logreplication - Enables additional replication debug output in the server log
- --new-cluster - Bootstraps a replication cluster and makes the server a reference node with cluster restart protection
- --new-cluster-force - Bootstraps a replication cluster and makes the server a reference node bypassing cluster restart protection
- --nodetach - Leaves searchd in foreground
- --ntservice - Passed by Microsoft Management Console to searchd to invoke it as a service on Windows platforms
- --pidfile - Overrides pid_file from the configuration file
- --port, p - Specifies port searchd should listen on disregarding the port specified in the configuration file
- --replay-flags - Specifies extra binary log replay options
- --servicename - Applies the given name to searchd when installing or deleting the service, as would appear in Microsoft Management Console
- --status - Queries running search to return its status
- --stop - Stops Manticore server
- --stopwait - Stops Manticore server gracefully
- --strip-path - Strips path names from all the file names referenced from the table
- -v - shows version information
- MANTICORE_TRACK_DAEMON_SHUTDOWN - enables detailed logging while searchd is shutting down
Miscellaneous table maintenance functionality useful for troubleshooting.
indextool <command> [options]Used to dump miscellaneous debug information about the physical table
indextool <command> [options]- --config, -c - Path to configuration file
- --quiet, -q - Keeps indextool quiet - it will not output banner, etc
- --help, -h - Lists all the parameters
- -v - Shows version information
- Indextool - Verifies configuration file
- --buildidf - Builds IDF file from one or several dictionary dumps
- --build-infixes - Build infixes for an existing dict=keywords table
- --dumpheader - Quickly dumps the provided table header file
- --dumpconfig - Dumps table definition from the given table header file in almost compliant manticore.conf file format
- --dumpheader - Dumps table header by table name with looking up the header path in the configuration file
- --dumpdict - Dumps table dictionary
- --dumpdocids - Dumps document IDs by table name
- --dumphitlist - Dumps all occurrences of the given keyword/id in the given table
- --docextract - Runs table check pass of whole dictionary/docs/hits, and collects all the words and hits belonging to requested document
- --fold - Tests tokenization based on table's settings
- --htmlstrip - Filters STDIN using HTML stripper settings for the given table
- --mergeidf - Merges several .idf files into a single one
- --morph - Applies morphology to the given STDIN and prints the result to stdout
- --check - Checks the table data files for consistency
- --check-id-dups - Checks if there are duplicate ids
- --check-disk-chunk - Checks one disk chunk of an RT table
- --strip-path - Strips path names from all the file names referenced from the table
- --rotate - Defines whether to check table waiting for rotation in
--check - --apply-killlists - Applies kill-lists for all tables listed in the configuration file
Splits compound words into components.
wordbreaker [-dict path/to/dictionary_file] {split|test|bench}- STDIN - To accept string to break into parts
- -dict - Specifies dictionary file to use
- split|test|bench - Specifies command
Used to extract contents of a dictionary file that uses ispell or MySpell format.
spelldump [options] <dictionary> <affix> [result] [locale-name]- dictionary - Dictionary's main file
- affix - Dictionary's affix file
- result - Specifies where the dictionary data should be output to
- locale-name - Specifies the locale details to use
A complete alphabetical list of keywords that are currently reserved in Manticore SQL syntax (and therefore can not be used as identifiers).
AND, AS, BY, COLUMNARSCAN, DISTINCT, DIV, DOCIDINDEX, EXPLAIN, FACET, FALSE, FORCE, FROM, IGNORE, IN, INDEXES, IS, LIMIT, MOD, NOT, NO_COLUMNARSCAN, NO_DOCIDINDEX, NO_SECONDARYINDEX, NULL, OFFSET, OR, ORDER, REGEX, RELOAD, SECONDARYINDEX, SELECT, SYSFILTERS, TRUE, USE