The SQL SHOW PROFILE statement and the "profile": true JSON interface option both provide a detailed execution profile of the executed query. In the case of SQL, profiling must be enabled in the current session before running the statement to be instrumented. This can be accomplished with the SET profiling=1 statement. By default, profiling is disabled to prevent potential performance implications, resulting in an empty profile if not enabled.
Each profiling result includes the following fields:
Statuscolumn briefly describes the specific state where the time was spent. See below.Durationcolumn shows the wall clock time, in seconds.Switchescolumn displays the number of times the query engine changed to the given state. These are merely logical engine state switches and not any OS level context switches or function calls (although some sections might actually map to function calls), and they do not have any direct effect on performance. In a sense, the number of switches is just the number of times the respective instrumentation point was hit.Percentcolumn shows the percentage of time spent in this state.
States in the profile are returned in a prerecorded order that roughly maps (but is not identical) to the actual query order.
The list of states may (and will) change over time as we refine the states. Here's a brief description of the currently profiled states.
unknown: generic catch-all state. Accounts for not-yet-instrumented code or small miscellaneous tasks that don't really belong in any other state but are too small to warrant their own state.net_read: reading the query from the network (i.e., the application).io: generic file IO time.dist_connect: connecting to remote agents in the distributed table case.sql_parse: parsing the SQL syntax.dict_setup: dictionary and tokenizer setup.parse: parsing the full-text query syntax.transforms: full-text query transformations (wildcard and other expansions, simplification, etc.).init: initializing the query evaluation.open: opening the table files.read_docs: IO time spent reading document lists.read_hits: IO time spent reading keyword positions.get_docs: computing the matching documents.get_hits: computing the matching positions.filter: filtering the full-text matches.rank: computing the relevance rank.sort: sorting the matches.finalize: finalizing the per-table search result set (last stage expressions, etc.).dist_wait: waiting for remote results from agents in the distributed table case.aggregate: aggregating multiple result sets.net_write: writing the result set to the network.
- SQL
- JSON
SET profiling=1;

SELECT id FROM forum WHERE MATCH('the best') LIMIT 1;

SHOW PROFILE;Query OK, 0 rows affected (0.00 sec)
+--------+
| id |
+--------+
| 241629 |
+--------+
1 row in set (0.35 sec)
+--------------+----------+----------+---------+
| Status | Duration | Switches | Percent |
+--------------+----------+----------+---------+
| unknown | 0.000557 | 5 | 0.16 |
| net_read | 0.000016 | 1 | 0.00 |
| local_search | 0.000076 | 1 | 0.02 |
| sql_parse | 0.000121 | 1 | 0.03 |
| dict_setup | 0.000003 | 1 | 0.00 |
| parse | 0.000072 | 1 | 0.02 |
| transforms | 0.000331 | 2 | 0.10 |
| init | 0.001945 | 3 | 0.56 |
| read_docs | 0.001257 | 76 | 0.36 |
| read_hits | 0.002598 | 186 | 0.75 |
| get_docs | 0.089328 | 2691 | 25.80 |
| get_hits | 0.189626 | 2799 | 54.78 |
| filter | 0.009369 | 2613 | 2.71 |
| rank | 0.029669 | 7760 | 8.57 |
| sort | 0.019070 | 2531 | 5.51 |
| finalize | 0.000001 | 1 | 0.00 |
| clone_attrs | 0.002009 | 1 | 0.58 |
| aggregate | 0.000054 | 2 | 0.02 |
| net_write | 0.000076 | 2 | 0.02 |
| eval_post | 0.000001 | 1 | 0.00 |
| total | 0.346179 | 18678 | 0 |
+--------------+----------+----------+---------+
21 rows in set (0.00 sec)The SHOW PLAN SQL statement and the "plan": N JSON interface option display the query execution plan. The plan is generated and stored during the actual execution, so in the case of SQL, profiling must be enabled in the current session before running that statement. This can be done with a SET profiling=1 statement.
Two items are returned in SQL mode:
transformed_tree, which displays the full-text query decomposition.enabled_indexes, which provides information about effective secondary indexes.
To view the query execution plan in a JSON query, add "plan": N to the query. The result will appear as a plan property in the result set. N can be one of the following:
- 1 - Displays only the textual plan of the root node, similar to the one returned in the
SHOW PLANSQL query. This is the most compact form. - 2 - Displays only the JSON object plan, useful for processing.
- 3 - Displays a JSON object with a textual description of every node. Note that the description for child nodes is also present and repeats part of the parent's description, which makes the whole representation quite large.
- SQL
- JSON
set profiling=1;

select * from hn_small where match('dog|cat') limit 0;

show plan;*************************** 1. row ***************************
Variable: transformed_tree
Value: OR(
AND(KEYWORD(dog, querypos=1)),
AND(KEYWORD(cat, querypos=2)))
*************************** 2. row ***************************
Variable: enabled_indexes
Value:
2 rows in set (0.00 sec)In some cases, the evaluated query tree can be quite different from the original one due to expansions and other transformations.
- SQL
- JSON
SET profiling=1;

SELECT id FROM forum WHERE MATCH('@title way* @content hey') LIMIT 1;

SHOW PLAN;Query OK, 0 rows affected (0.00 sec)
+--------+
| id |
+--------+
| 711651 |
+--------+
1 row in set (0.04 sec)
+------------------+-------------------------------------------------------------------------------------------------------------------------------------------------------------------------------------------------------------------------------------------------------------------------------------------------------------------------------------------------------------------------------------------------------------------------+
| Variable | Value |
+------------------+-------------------------------------------------------------------------------------------------------------------------------------------------------------------------------------------------------------------------------------------------------------------------------------------------------------------------------------------------------------------------------------------------------------------------+
| transformed_tree | AND(
OR(
OR(
AND(fields=(title), KEYWORD(wayne, querypos=1, expanded)),
OR(
AND(fields=(title), KEYWORD(ways, querypos=1, expanded)),
AND(fields=(title), KEYWORD(wayyy, querypos=1, expanded)))),
AND(fields=(title), KEYWORD(way, querypos=1, expanded)),
OR(fields=(title), KEYWORD(way*, querypos=1, expanded))),
AND(fields=(content), KEYWORD(hey, querypos=2))) |
+------------------+-------------------------------------------------------------------------------------------------------------------------------------------------------------------------------------------------------------------------------------------------------------------------------------------------------------------------------------------------------------------------------------------------------------------------+
1 row in set (0.00 sec)See also EXPLAIN QUERY. It displays the execution tree of a full-text query without actually executing the query. Note that when using SHOW PLAN after a query to a real-time table, the result will be based on a random disk/RAM chunk. Therefore, if you have recently modified the table's tokenization settings, or if the chunks vary significantly in terms of dictionaries, etc., you might not get the result you are expecting. Take this into account and consider using EXPLAIN QUERY as well.
query property contains the transformed full-text query tree. Each node contains:
type: node type. Can beAND,OR,PHRASE,KEYWORD, etc.description: query subtree for this node shown as a string (inSHOW PLANformat).children: child nodes, if any.max_field_pos: maximum position within a field.word: transformed keyword. Keyword nodes only.querypos: position of this keyword in a query. Keyword nodes only.excluded: keyword excluded from query. Keyword nodes only.expanded: keyword added by prefix expansion. Keyword nodes only.field_start: keyword must occur at the very start of the field. Keyword nodes only.field_end: keyword must occur at the very end of the field. Keyword nodes only.boost: keyword IDF will be multiplied by this. Keyword nodes only.
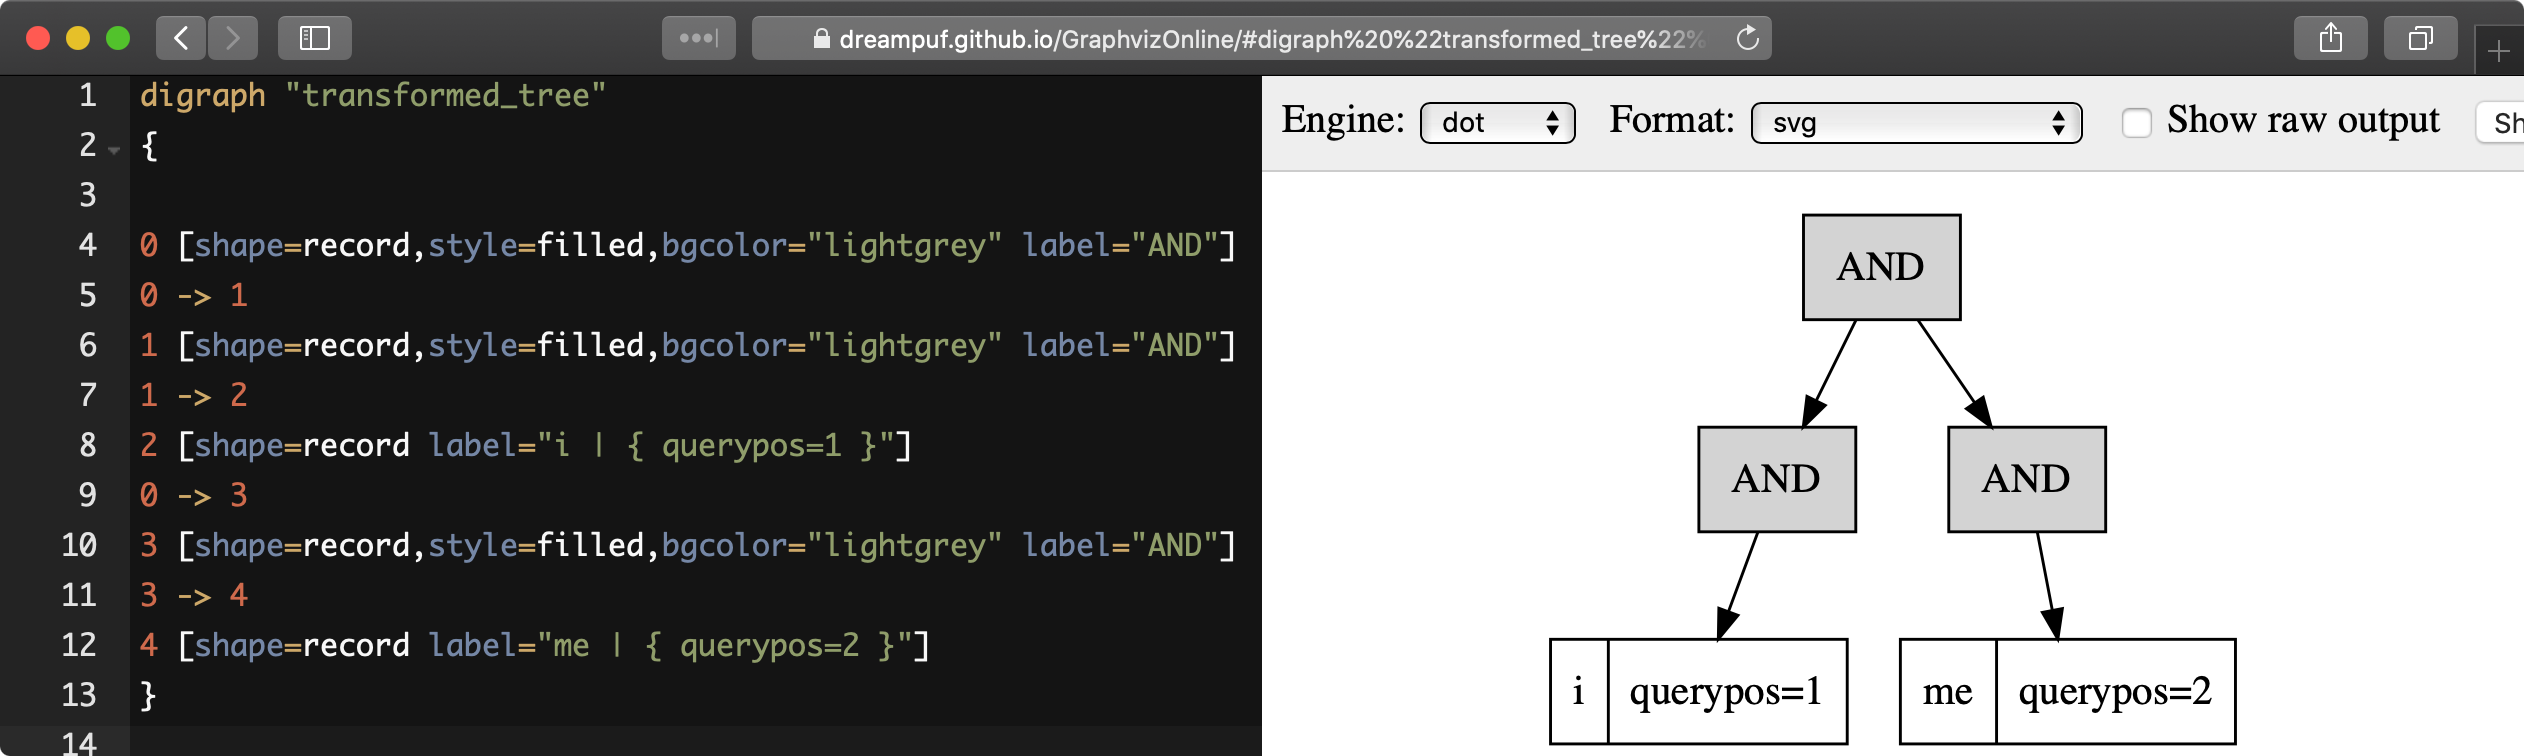
SHOW PLAN format=dot allows returning the full-text query execution tree in a hierarchical format suitable for visualization by existing tools, such as https://dreampuf.github.io/GraphvizOnline:
MySQL [(none)]> show plan option format=dot\G
*************************** 1. row ***************************
Variable: transformed_tree
   Value: digraph "transformed_tree"
{

0 [shape=record,style=filled,bgcolor="lightgrey" label="AND"]
0 -> 1
1 [shape=record,style=filled,bgcolor="lightgrey" label="AND"]
1 -> 2
2 [shape=record label="i | { querypos=1 }"]
0 -> 3
3 [shape=record,style=filled,bgcolor="lightgrey" label="AND"]
3 -> 4
4 [shape=record label="me | { querypos=2 }"]
}